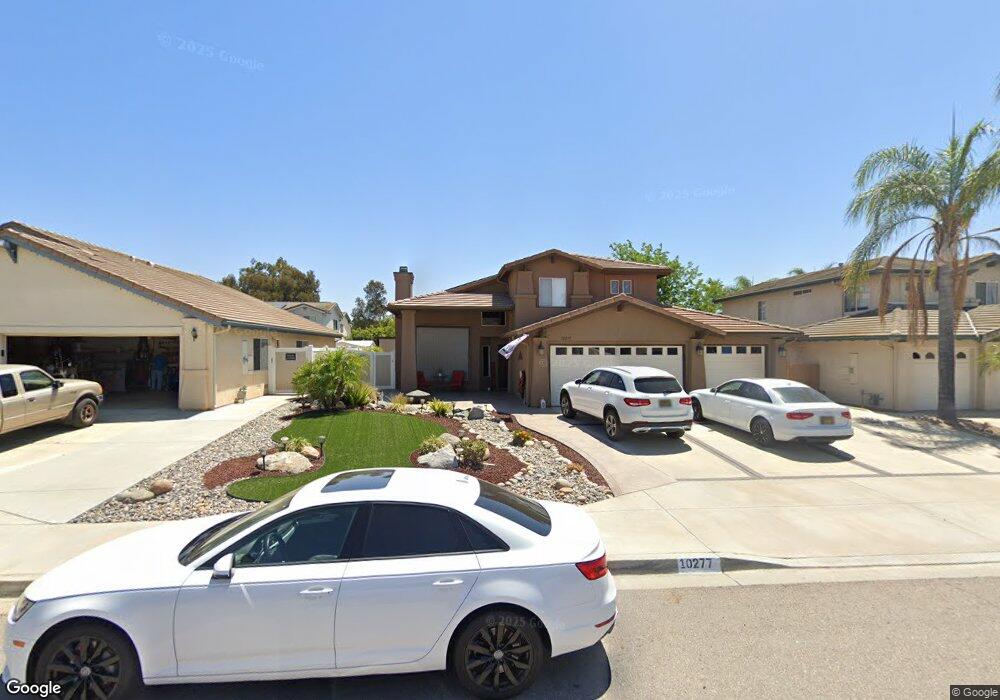
10277 Pinon Place Lakeside, CA 92040
Estimated Value: $841,638 - $918,000
4
Beds
3
Baths
1,868
Sq Ft
$479/Sq Ft
Est. Value
About This Home
This home is located at 10277 Pinon Place, Lakeside, CA 92040 and is currently estimated at $895,410, approximately $479 per square foot. 10277 Pinon Place is a home located in San Diego County with nearby schools including Lakeside Farms Elementary School, Lakeside Middle School, and Santana High School.
Ownership History
Date
Name
Owned For
Owner Type
Purchase Details
Closed on
Oct 20, 2021
Sold by
Glowacki John C and Glowacki Tammie S
Bought by
Glowacki John C and Glowacki Tammie S
Current Estimated Value
Home Financials for this Owner
Home Financials are based on the most recent Mortgage that was taken out on this home.
Original Mortgage
$198,050
Outstanding Balance
$127,002
Interest Rate
2.8%
Mortgage Type
New Conventional
Estimated Equity
$768,408
Purchase Details
Closed on
Feb 2, 2021
Sold by
Glowacki John C and Glowacki Tammie S
Bought by
Glowacki John C and Glowacki Tammie S
Purchase Details
Closed on
Jun 13, 2012
Sold by
Glowacki John C and Glowacki Tammie S
Bought by
Glowacki John C and Glowacki Tammie S
Purchase Details
Closed on
Mar 20, 2001
Sold by
Pinery 83 Lp
Bought by
Glowacki John C and Glowacki Tammie S
Home Financials for this Owner
Home Financials are based on the most recent Mortgage that was taken out on this home.
Original Mortgage
$219,900
Interest Rate
6.97%
Create a Home Valuation Report for This Property
The Home Valuation Report is an in-depth analysis detailing your home's value as well as a comparison with similar homes in the area
Home Values in the Area
Average Home Value in this Area
Purchase History
| Date | Buyer | Sale Price | Title Company |
|---|---|---|---|
| Glowacki John C | -- | Wfg Title Company Of Ca | |
| Glowacki John C | -- | Accommodation | |
| Glowacki John C | -- | None Available | |
| Glowacki John C | $275,000 | First American Title |
Source: Public Records
Mortgage History
| Date | Status | Borrower | Loan Amount |
|---|---|---|---|
| Open | Glowacki John C | $198,050 | |
| Closed | Glowacki John C | $219,900 |
Source: Public Records
Tax History Compared to Growth
Tax History
| Year | Tax Paid | Tax Assessment Tax Assessment Total Assessment is a certain percentage of the fair market value that is determined by local assessors to be the total taxable value of land and additions on the property. | Land | Improvement |
|---|---|---|---|---|
| 2025 | $4,917 | $414,176 | $138,619 | $275,557 |
| 2024 | $4,917 | $406,055 | $135,901 | $270,154 |
| 2023 | $4,743 | $398,094 | $133,237 | $264,857 |
| 2022 | $4,668 | $390,289 | $130,625 | $259,664 |
| 2021 | $4,600 | $382,637 | $128,064 | $254,573 |
| 2020 | $4,549 | $378,714 | $126,751 | $251,963 |
| 2019 | $4,468 | $371,289 | $124,266 | $247,023 |
| 2018 | $4,414 | $364,010 | $121,830 | $242,180 |
| 2017 | $4,353 | $356,874 | $119,442 | $237,432 |
| 2016 | $4,229 | $349,877 | $117,100 | $232,777 |
| 2015 | $4,200 | $344,623 | $115,342 | $229,281 |
| 2014 | $3,987 | $337,873 | $113,083 | $224,790 |
Source: Public Records
Map
Nearby Homes
- 11320 El Nopal Unit 5619
- 11436 El Nopal
- 11034 Brookfield Ct
- 0 Riverford Rd Unit 3
- 10103 Riverhill Ln
- 11010 El Nopal
- 11529 Woodside Ave
- 10410 Bosque Dr
- 0 Santana St
- 10703 Oak Creek Dr
- 11851 Riverside Dr Unit 206
- 11949 Riverside Dr Unit 28
- 11949 Riverside Dr Unit 23
- 11949 Riverside Dr Unit 7
- 11949 Riverside Dr Unit 176
- 10473 Towns Terrace
- 10651 Trigal Way
- 10252 Casa Ct
- 9717 Follett Dr
- 11977 Raceway Ln
- 10269 Pinon Place
- 10285 Pinon Place
- 11305 Big Cone Dr
- 10284 Big Cone Ct
- 10261 Pinon Place
- 10276 Big Cone Ct
- 11267 Big Cone Dr
- 11317 Big Cone Dr
- 10268 Big Cone Ct
- 10268 Pinon Place
- 10253 Pinon Place
- 11255 Big Cone Dr
- 11284 Big Cone Dr
- 11276 Big Cone Dr
- 10260 Pinon Place
- 10260 Big Cone Ct
- 11268 Big Cone Dr
- 11292 Big Cone Dr
- 10245 Pinon Place
- 11306 Big Cone Dr