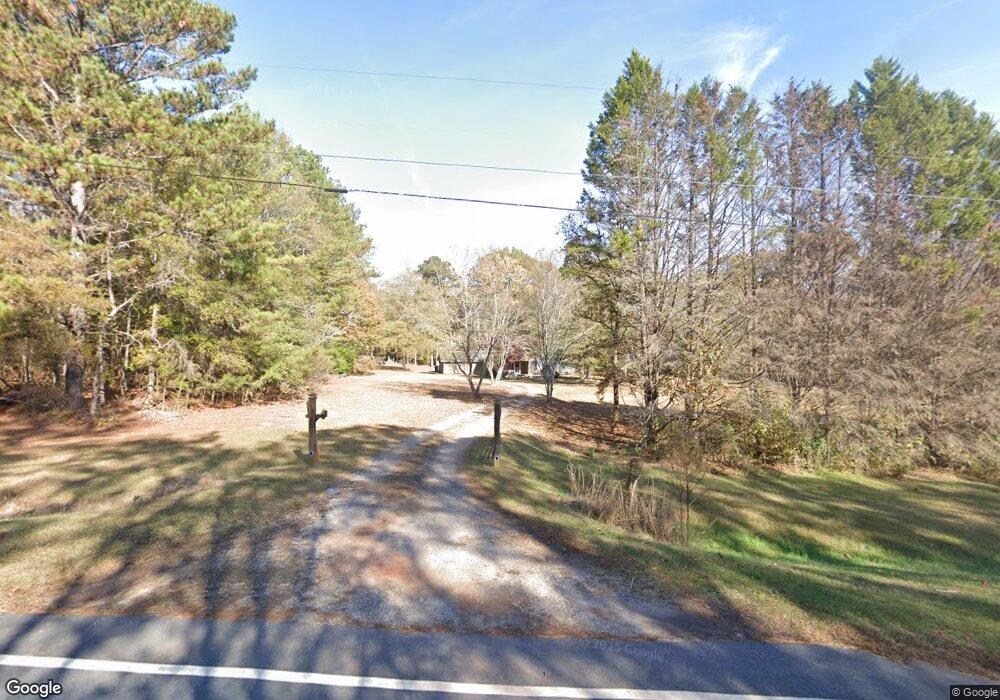
1028 Drew Allen Rd Williamson, GA 30292
Estimated Value: $282,000 - $385,649
3
Beds
3
Baths
1,892
Sq Ft
$173/Sq Ft
Est. Value
About This Home
This home is located at 1028 Drew Allen Rd, Williamson, GA 30292 and is currently estimated at $327,912, approximately $173 per square foot. 1028 Drew Allen Rd is a home located in Pike County with nearby schools including Pike County Primary School, Pike County Elementary School, and Pike County Middle School.
Ownership History
Date
Name
Owned For
Owner Type
Purchase Details
Closed on
Oct 8, 2020
Sold by
Wright Susan L
Bought by
Daniel David Tanner
Current Estimated Value
Home Financials for this Owner
Home Financials are based on the most recent Mortgage that was taken out on this home.
Original Mortgage
$180,580
Outstanding Balance
$160,323
Interest Rate
2.8%
Mortgage Type
New Conventional
Estimated Equity
$167,589
Purchase Details
Closed on
May 1, 2013
Sold by
Wright Maurice K
Bought by
Wright Susan L
Purchase Details
Closed on
May 11, 2011
Sold by
Federal National Mortgage Association
Bought by
Wright Maurice K
Home Financials for this Owner
Home Financials are based on the most recent Mortgage that was taken out on this home.
Original Mortgage
$94,590
Interest Rate
4.88%
Mortgage Type
New Conventional
Purchase Details
Closed on
Jul 3, 2000
Sold by
Zajac Scott A
Bought by
Woods Kevin H
Purchase Details
Closed on
Aug 30, 1996
Sold by
Scott Diane T
Bought by
Zajac Scott A
Create a Home Valuation Report for This Property
The Home Valuation Report is an in-depth analysis detailing your home's value as well as a comparison with similar homes in the area
Home Values in the Area
Average Home Value in this Area
Purchase History
| Date | Buyer | Sale Price | Title Company |
|---|---|---|---|
| Daniel David Tanner | $174,900 | -- | |
| Wright Susan L | -- | -- | |
| Wright Maurice K | -- | -- | |
| Wright Maurice K | -- | -- | |
| Woods Kevin H | $119,900 | -- | |
| Zajac Scott A | $99,900 | -- |
Source: Public Records
Mortgage History
| Date | Status | Borrower | Loan Amount |
|---|---|---|---|
| Open | Daniel David Tanner | $180,580 | |
| Previous Owner | Wright Maurice K | $94,590 |
Source: Public Records
Tax History Compared to Growth
Tax History
| Year | Tax Paid | Tax Assessment Tax Assessment Total Assessment is a certain percentage of the fair market value that is determined by local assessors to be the total taxable value of land and additions on the property. | Land | Improvement |
|---|---|---|---|---|
| 2024 | $2,400 | $98,753 | $31,360 | $67,393 |
| 2023 | $2,135 | $98,753 | $31,360 | $67,393 |
| 2022 | $1,501 | $76,944 | $31,360 | $45,584 |
| 2021 | $1,497 | $67,904 | $22,320 | $45,584 |
| 2020 | $1,513 | $67,904 | $22,320 | $45,584 |
| 2019 | $1,292 | $55,549 | $22,320 | $33,229 |
| 2018 | $1,291 | $55,549 | $22,320 | $33,229 |
| 2017 | $1,279 | $55,549 | $22,320 | $33,229 |
| 2016 | $1,186 | $55,549 | $22,320 | $33,229 |
| 2015 | $1,127 | $55,549 | $22,320 | $33,229 |
| 2014 | $1,127 | $55,080 | $22,320 | $32,760 |
| 2013 | -- | $55,080 | $22,320 | $32,760 |
Source: Public Records
Map
Nearby Homes
- 291 Millie Tr
- 46 Millie Tr
- 15316 Concord St
- 95 Joshua Ct
- 2505 Plan at Ashley Glen
- 2604 Plan at Ashley Glen
- 2316 Plan at Ashley Glen
- 1902 Plan at Ashley Glen
- 2100 Plan at Ashley Glen
- 0 US Highway 19 Unit 10432667
- 171 Jackson St
- 16156 Barnesville St
- 274 Caldwell Rd
- 308 Wrightsburg Way
- 203 Pine St
- 94 Wrightsburg Way
- 106 Wrightsburg Way
- 244 Wrightsburg Way
- 123 Griffin St
- 264 Brown Station Dr
- 1174 Drew Allen Rd
- 0 Drew Allen Rd Unit 6.5AC 7502046
- 0 Drew Allen Rd Unit 6.5AC 8056708
- 1058 Drew Allen Rd
- 1109 Drew Allen Rd Unit 2
- 1151 Drew Allen Rd Unit 3
- 1151 Drew Allen Rd
- 1175 Drew Allen Rd Unit 4
- 794 Drew Allen Rd
- 1003 Drew Allen Rd
- 804 Drew Allen Rd
- 1187 Drew Allen Rd
- 1187 Drew Allen Rd Unit 5
- 1187 Drew Allen Rd Unit 9
- 1187 Drew Allen Rd Unit 8
- 1187 Drew Allen Rd Unit 7
- 1187 Drew Allen Rd Unit 6
- 1356 Drew Allen Rd
- 809 Drew Allen Rd
- 766 Drew Allen Rd