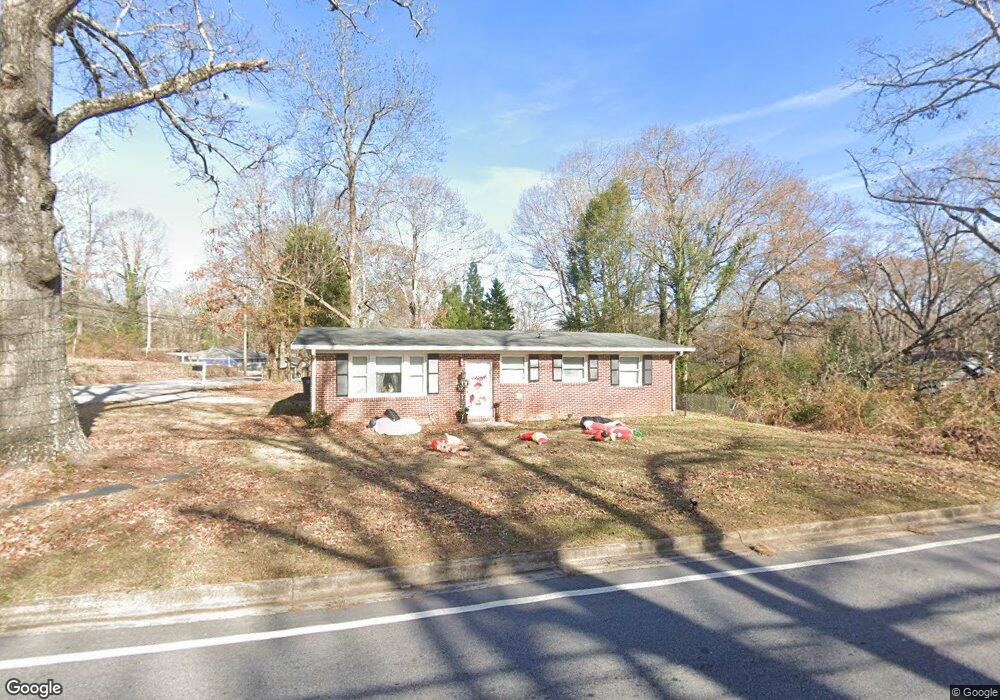
1028 Lakeview Dr Gainesville, GA 30501
Lake Lanier NeighborhoodEstimated Value: $247,746 - $291,000
3
Beds
2
Baths
1,125
Sq Ft
$237/Sq Ft
Est. Value
About This Home
This home is located at 1028 Lakeview Dr, Gainesville, GA 30501 and is currently estimated at $266,187, approximately $236 per square foot. 1028 Lakeview Dr is a home located in Hall County with nearby schools including New Holland Core Knowledge Academy, Gainesville Middle School, and Gainesville High School.
Ownership History
Date
Name
Owned For
Owner Type
Purchase Details
Closed on
Mar 11, 2019
Sold by
Krm 2016 Ll
Bought by
Gerrald & Lee Properties Llc
Current Estimated Value
Home Financials for this Owner
Home Financials are based on the most recent Mortgage that was taken out on this home.
Original Mortgage
$80,000
Interest Rate
4.4%
Mortgage Type
Commercial
Purchase Details
Closed on
Aug 23, 2016
Bought by
Krm 2016 Llc
Purchase Details
Closed on
Nov 20, 2015
Sold by
E K Martin Sr Properties Llc
Bought by
Deaton Royce
Purchase Details
Closed on
Dec 23, 2008
Sold by
Sutherland Farms Inc
Bought by
Ek Martin Sr Properties Llc
Purchase Details
Closed on
Sep 14, 2007
Sold by
E and K
Bought by
Sutherland Farms Inc
Purchase Details
Closed on
Oct 7, 2005
Sold by
Adams Carol Diane
Bought by
Martin Eddie K
Create a Home Valuation Report for This Property
The Home Valuation Report is an in-depth analysis detailing your home's value as well as a comparison with similar homes in the area
Home Values in the Area
Average Home Value in this Area
Purchase History
| Date | Buyer | Sale Price | Title Company |
|---|---|---|---|
| Gerrald & Lee Properties Llc | $110,000 | -- | |
| Krm 2016 Llc | $80,000 | -- | |
| Deaton Royce | $120,000 | -- | |
| Ek Martin Sr Properties Llc | $380,000 | -- | |
| Sutherland Farms Inc | $240,000 | -- | |
| Martin Eddie K | $100,000 | -- |
Source: Public Records
Mortgage History
| Date | Status | Borrower | Loan Amount |
|---|---|---|---|
| Closed | Gerrald & Lee Properties Llc | $80,000 |
Source: Public Records
Tax History Compared to Growth
Tax History
| Year | Tax Paid | Tax Assessment Tax Assessment Total Assessment is a certain percentage of the fair market value that is determined by local assessors to be the total taxable value of land and additions on the property. | Land | Improvement |
|---|---|---|---|---|
| 2025 | $2,571 | $90,440 | $12,200 | $78,240 |
| 2024 | $2,371 | $82,800 | $12,520 | $70,280 |
| 2023 | $327 | $81,640 | $12,520 | $69,120 |
| 2022 | $287 | $60,960 | $7,280 | $53,680 |
| 2021 | $295 | $56,600 | $7,280 | $49,320 |
| 2020 | $1,323 | $53,800 | $7,280 | $46,520 |
| 2019 | $1,837 | $60,200 | $10,440 | $49,760 |
| 2018 | $305 | $51,400 | $10,440 | $40,960 |
| 2017 | $293 | $43,680 | $8,320 | $35,360 |
| 2016 | $943 | $31,120 | $8,320 | $22,800 |
| 2015 | $154 | $25,228 | $5,840 | $19,388 |
| 2014 | $154 | $25,228 | $5,840 | $19,388 |
Source: Public Records
Map
Nearby Homes
- 915 Charleston Ct
- 1824 Kettle Crossing
- 1820 Kettle Crossing
- 2728 Limestone Creek Dr
- 1387 Springdale Rd
- 3 & 5 Indianola Dr
- 943 Parkhill Place
- 1531 Enota Ave NE
- 1225 Cumberland Valley Rd
- 1505 Robinhood Trail
- 1971 Assembly (Lot 164) Cir
- 1235 Riverside Dr Unit F6
- 1235 Riverside Dr Unit F5
- 1093 Enota Ave NE
- 1173 Saint Charles Place
- 1436 Vine St NE
- 1047 Lanier Ave
- 1456 Heritage Rd
- 1304 Vine St NE
- 1539 Berkeley Ct
- 1640 Lakeview Cir
- 1046 Lakeview Dr
- 1009 Lakeview Dr
- 1014 Lakeview Dr
- 1021 Lakeview Dr
- 1033 Lakeview Dr
- 1654 Lakeview Cir
- 1631 Lakeview Cir
- 1058 Lakeview Dr
- 1002 Lakeview Dr
- 1651 Lakeview Cir
- 899 Charleston Ct
- 1670 Lakeview Cir
- 2670 Lakeview Dr
- 1640 Lakeview Place
- 1062 Lakeview Dr
- 907 Charleston Ct
- 891 Charleston Ct
- 903 Charleston Ct
- 1682 Lakeview Cir