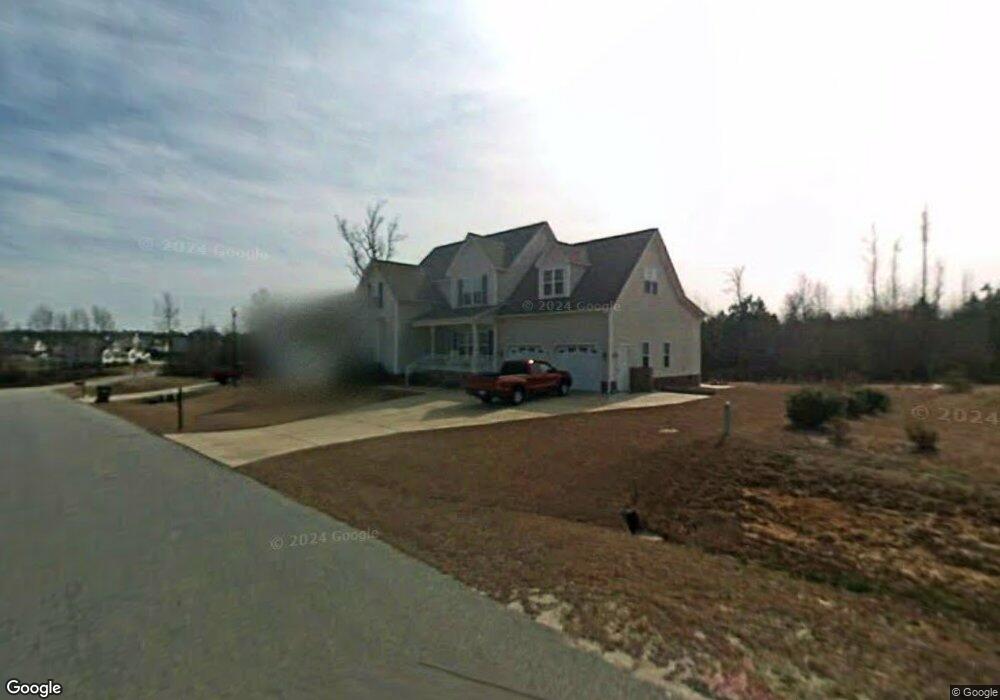
1028 Linden Crest Rd Raleigh, NC 27603
Estimated Value: $425,000 - $540,000
3
Beds
3
Baths
2,555
Sq Ft
$182/Sq Ft
Est. Value
About This Home
This home is located at 1028 Linden Crest Rd, Raleigh, NC 27603 and is currently estimated at $466,191, approximately $182 per square foot. 1028 Linden Crest Rd is a home located in Wake County with nearby schools including Rand Road Elementary, North Garner Middle, and South Garner High.
Ownership History
Date
Name
Owned For
Owner Type
Purchase Details
Closed on
Oct 15, 2020
Sold by
Bebber Grady B and King Hilda
Bought by
Newman Benjamin Keller and Newman Benjamin K
Current Estimated Value
Home Financials for this Owner
Home Financials are based on the most recent Mortgage that was taken out on this home.
Original Mortgage
$270,750
Outstanding Balance
$240,818
Interest Rate
2.9%
Mortgage Type
New Conventional
Estimated Equity
$225,373
Purchase Details
Closed on
Mar 25, 2013
Sold by
Fulbright Ellis G and Fulbright Ruby J
Bought by
Bebber Grady B
Home Financials for this Owner
Home Financials are based on the most recent Mortgage that was taken out on this home.
Original Mortgage
$100,000
Interest Rate
3.56%
Mortgage Type
New Conventional
Purchase Details
Closed on
Sep 30, 2002
Sold by
Comfort Homes Inc
Bought by
Fulbright Ellis G and Fulbright Ruby J
Home Financials for this Owner
Home Financials are based on the most recent Mortgage that was taken out on this home.
Original Mortgage
$142,320
Interest Rate
5.6%
Create a Home Valuation Report for This Property
The Home Valuation Report is an in-depth analysis detailing your home's value as well as a comparison with similar homes in the area
Home Values in the Area
Average Home Value in this Area
Purchase History
| Date | Buyer | Sale Price | Title Company |
|---|---|---|---|
| Newman Benjamin Keller | $285,000 | None Available | |
| Bebber Grady B | $200,000 | None Available | |
| Fulbright Ellis G | $178,000 | -- |
Source: Public Records
Mortgage History
| Date | Status | Borrower | Loan Amount |
|---|---|---|---|
| Open | Newman Benjamin Keller | $270,750 | |
| Previous Owner | Bebber Grady B | $100,000 | |
| Previous Owner | Fulbright Ellis G | $142,320 | |
| Closed | Fulbright Ellis G | $17,800 |
Source: Public Records
Tax History Compared to Growth
Tax History
| Year | Tax Paid | Tax Assessment Tax Assessment Total Assessment is a certain percentage of the fair market value that is determined by local assessors to be the total taxable value of land and additions on the property. | Land | Improvement |
|---|---|---|---|---|
| 2025 | $2,873 | $446,076 | $115,000 | $331,076 |
| 2024 | $2,884 | $461,125 | $115,000 | $346,125 |
| 2023 | $2,248 | $285,702 | $40,000 | $245,702 |
| 2022 | $2,083 | $285,702 | $40,000 | $245,702 |
| 2021 | $2,028 | $285,702 | $40,000 | $245,702 |
| 2020 | $1,994 | $285,702 | $40,000 | $245,702 |
| 2019 | $1,991 | $241,308 | $40,000 | $201,308 |
| 2018 | $1,831 | $241,308 | $40,000 | $201,308 |
| 2017 | $1,736 | $241,308 | $40,000 | $201,308 |
| 2016 | $1,701 | $241,308 | $40,000 | $201,308 |
| 2015 | $1,512 | $214,810 | $34,000 | $180,810 |
| 2014 | $1,433 | $214,810 | $34,000 | $180,810 |
Source: Public Records
Map
Nearby Homes
- 920 Shadywood Ln
- 1116 Shadywood Ln
- 5013 Contender Dr
- 4721 Sandy Bay Cir
- 10001 Joe Leach Rd
- 8500 Old Ponderosa Cir
- 9505 Neils Branch Rd
- 4117 Bashford Bluffs Ln
- 9017 Hunterfox Ct
- 701 Rand Rd
- 700 Arbor Greene Dr
- 316 Arbor Greene Dr
- 1101 Robinfield Dr
- 8001 Lakeshore Dr
- 901 Edgewater Dr
- 449 Kings Hollow Dr
- 1009 Feldmen Dr
- 1559 Upchurch Woods Dr
- 1004 Cabin Hill Way
- 212 Bluefield Dr
- 1032 Linden Crest Rd
- 1024 Linden Crest Rd
- 4809 Spruce Hill Ln
- 1020 Linden Crest Rd
- 1017 Linden Crest Rd
- 1016 Linden Crest Rd
- 4804 Spruce Hill Ln
- 1012 Linden Crest Rd
- 4801 Spruce Hill Ln
- 1009 Linden Crest Rd
- 4924 Saulsridge Rd
- 1008 Linden Crest Rd
- 4800 Spruce Hill Ln
- 1104 Linden Crest Rd
- 1101 Linden Crest Rd
- 4921 Saulsridge Rd
- 4913 Saulsridge Rd Unit PUMP
- 1001 Rockwell Ct
- 8617 Crowder Rd
- 4840 Topstone Rd