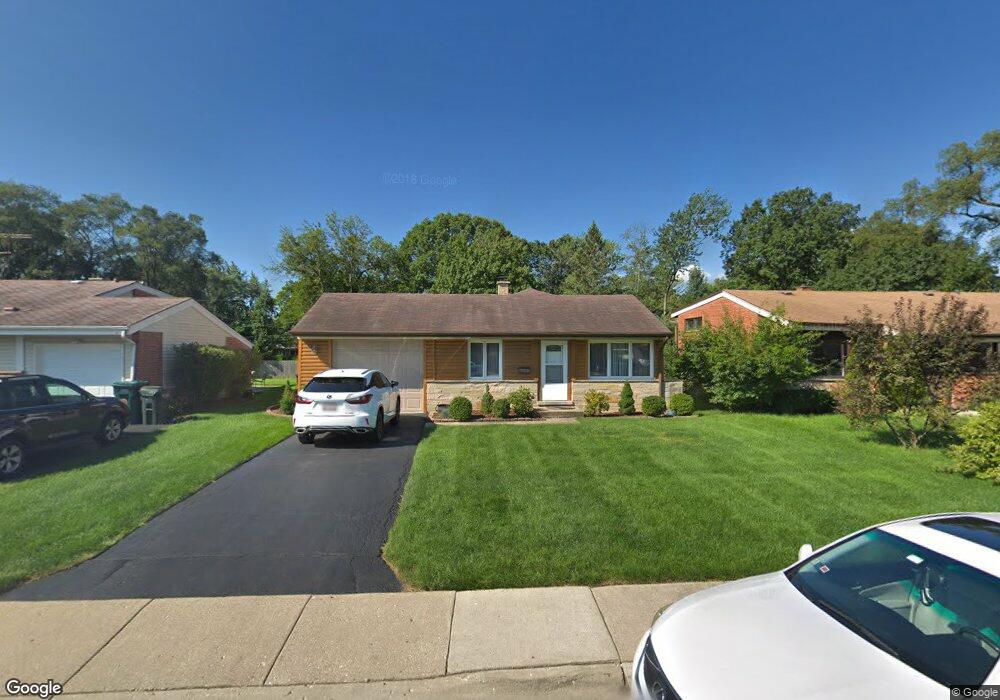
1028 Longaker Rd Northbrook, IL 60062
Estimated Value: $413,000 - $499,000
3
Beds
1
Bath
1,072
Sq Ft
$413/Sq Ft
Est. Value
About This Home
This home is located at 1028 Longaker Rd, Northbrook, IL 60062 and is currently estimated at $442,995, approximately $413 per square foot. 1028 Longaker Rd is a home located in Cook County with nearby schools including Meadowbrook Elementary School, Northbrook Junior High School, and Glenbrook North High School.
Ownership History
Date
Name
Owned For
Owner Type
Purchase Details
Closed on
Jun 27, 2005
Sold by
Benson Michael W and Benson Sarah J
Bought by
Kaleta Krol Dorota
Current Estimated Value
Home Financials for this Owner
Home Financials are based on the most recent Mortgage that was taken out on this home.
Original Mortgage
$328,000
Outstanding Balance
$180,408
Interest Rate
6.5%
Mortgage Type
Fannie Mae Freddie Mac
Estimated Equity
$262,587
Purchase Details
Closed on
Aug 2, 1999
Sold by
Biritz Matthew J and Biritz Joyce E
Bought by
Benson Michael W and Benson Sarah J
Home Financials for this Owner
Home Financials are based on the most recent Mortgage that was taken out on this home.
Original Mortgage
$168,800
Interest Rate
7.68%
Purchase Details
Closed on
Jun 3, 1997
Sold by
Biritz Matthew J and Biritz Joyce E
Bought by
Biritz Matthew J and Biritz Joyce E
Create a Home Valuation Report for This Property
The Home Valuation Report is an in-depth analysis detailing your home's value as well as a comparison with similar homes in the area
Home Values in the Area
Average Home Value in this Area
Purchase History
| Date | Buyer | Sale Price | Title Company |
|---|---|---|---|
| Kaleta Krol Dorota | $410,000 | 1St American Title | |
| Benson Michael W | $211,000 | -- | |
| Biritz Matthew J | -- | -- |
Source: Public Records
Mortgage History
| Date | Status | Borrower | Loan Amount |
|---|---|---|---|
| Open | Kaleta Krol Dorota | $328,000 | |
| Previous Owner | Benson Michael W | $168,800 |
Source: Public Records
Tax History Compared to Growth
Tax History
| Year | Tax Paid | Tax Assessment Tax Assessment Total Assessment is a certain percentage of the fair market value that is determined by local assessors to be the total taxable value of land and additions on the property. | Land | Improvement |
|---|---|---|---|---|
| 2024 | $6,324 | $31,000 | $10,249 | $20,751 |
| 2023 | $6,111 | $31,000 | $10,249 | $20,751 |
| 2022 | $6,111 | $31,000 | $10,249 | $20,751 |
| 2021 | $4,692 | $22,112 | $8,278 | $13,834 |
| 2020 | $4,654 | $22,112 | $8,278 | $13,834 |
| 2019 | $4,514 | $24,299 | $8,278 | $16,021 |
| 2018 | $4,167 | $21,228 | $7,292 | $13,936 |
| 2017 | $4,073 | $21,228 | $7,292 | $13,936 |
| 2016 | $4,019 | $21,228 | $7,292 | $13,936 |
| 2015 | $4,190 | $20,308 | $6,110 | $14,198 |
| 2014 | $4,015 | $20,308 | $6,110 | $14,198 |
| 2013 | $3,877 | $20,308 | $6,110 | $14,198 |
Source: Public Records
Map
Nearby Homes
- 1043 Whitfield Rd Unit 2
- 908 Dell Rd
- 1022 Whitfield Rd
- 828 Dell Rd
- 24 Bridlewood Rd
- 1135 Buttonwood Ln
- 746 Woodridge Ln
- 34 Bridlewood Rd
- 650 Midfield Ln
- 759 Strawberry Hill Dr
- 1219 Ridgewood Dr
- 350 Sunset Ct
- 845 Shermer Rd
- 1425 Lee Rd
- 1265 Longmeadow Ln
- 1133 Mayfair Ln
- 535 Fairway Ln
- 1254 Walters Ave
- 1125 Hohlfelder Rd
- 1 Morrison Rd
- 1030 Longaker Rd Unit 4
- 1024 Longaker Rd
- 1034 Longaker Rd
- 1029 Dell Rd
- 1027 Dell Rd
- 1033 Dell Rd
- 1025 Dell Rd
- 1022 Longaker Rd
- 1036 Longaker Rd
- 1029 Longaker Rd
- 1035 Dell Rd
- 1031 Longaker Rd
- 1025 Longaker Rd
- 1035 Longaker Rd
- 1023 Dell Rd
- 1015 Longaker Rd
- 1018 Longaker Rd
- 1040 Longaker Rd
- 1039 Dell Rd
- 1037 Longaker Rd