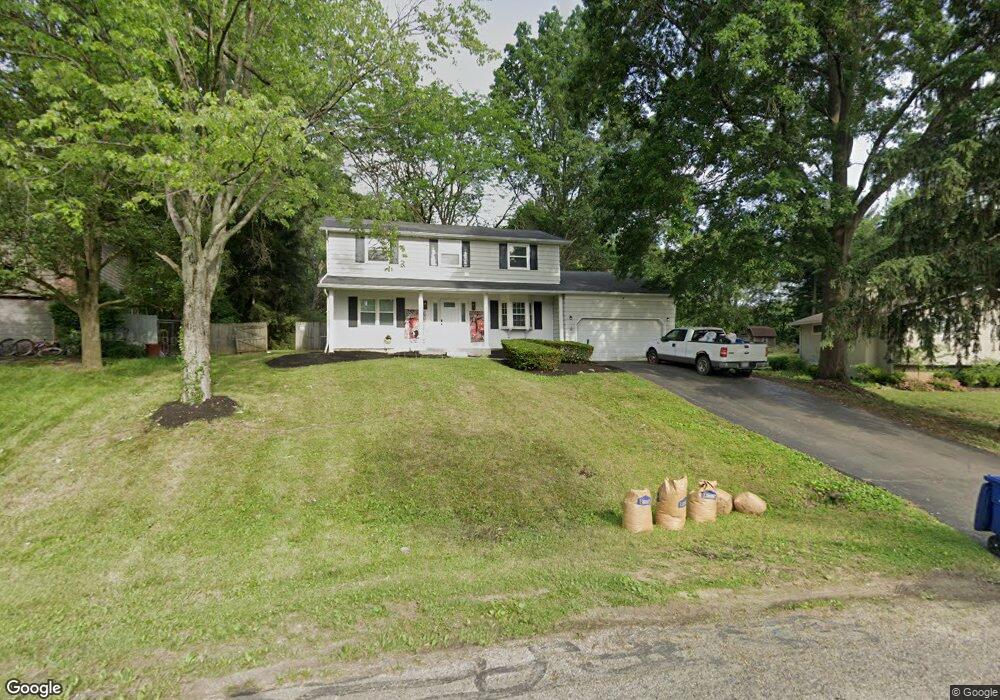
1028 Lornaberry Ln Columbus, OH 43213
Olde Orchard NeighborhoodEstimated Value: $342,021 - $396,000
4
Beds
3
Baths
2,060
Sq Ft
$182/Sq Ft
Est. Value
About This Home
This home is located at 1028 Lornaberry Ln, Columbus, OH 43213 and is currently estimated at $374,505, approximately $181 per square foot. 1028 Lornaberry Ln is a home located in Franklin County with nearby schools including Olde Orchard Elementary School, Sherwood Middle School, and Walnut Ridge High School.
Ownership History
Date
Name
Owned For
Owner Type
Purchase Details
Closed on
May 19, 2006
Sold by
Cooney Michael J and Cooney Dana L
Bought by
Moore Jawanza and Moore Bethany D
Current Estimated Value
Home Financials for this Owner
Home Financials are based on the most recent Mortgage that was taken out on this home.
Original Mortgage
$161,600
Outstanding Balance
$112,897
Interest Rate
10.35%
Mortgage Type
Fannie Mae Freddie Mac
Estimated Equity
$261,608
Purchase Details
Closed on
Dec 9, 2002
Sold by
Zim Pilkenton Susan M and Zim Michael W
Bought by
Cooney Michael J
Home Financials for this Owner
Home Financials are based on the most recent Mortgage that was taken out on this home.
Original Mortgage
$157,140
Interest Rate
6.23%
Mortgage Type
Purchase Money Mortgage
Create a Home Valuation Report for This Property
The Home Valuation Report is an in-depth analysis detailing your home's value as well as a comparison with similar homes in the area
Home Values in the Area
Average Home Value in this Area
Purchase History
| Date | Buyer | Sale Price | Title Company |
|---|---|---|---|
| Moore Jawanza | $202,000 | Talon Group | |
| Cooney Michael J | $162,000 | Chicago Title |
Source: Public Records
Mortgage History
| Date | Status | Borrower | Loan Amount |
|---|---|---|---|
| Open | Moore Jawanza | $161,600 | |
| Closed | Cooney Michael J | $157,140 |
Source: Public Records
Tax History Compared to Growth
Tax History
| Year | Tax Paid | Tax Assessment Tax Assessment Total Assessment is a certain percentage of the fair market value that is determined by local assessors to be the total taxable value of land and additions on the property. | Land | Improvement |
|---|---|---|---|---|
| 2024 | $4,780 | $106,510 | $31,260 | $75,250 |
| 2023 | $4,858 | $106,505 | $31,255 | $75,250 |
| 2022 | $3,747 | $72,240 | $35,700 | $36,540 |
| 2021 | $4,155 | $72,240 | $35,700 | $36,540 |
| 2020 | $3,919 | $72,240 | $35,700 | $36,540 |
| 2019 | $3,786 | $62,410 | $31,050 | $31,360 |
| 2018 | $3,629 | $62,410 | $31,050 | $31,360 |
| 2017 | $3,808 | $62,410 | $31,050 | $31,360 |
| 2016 | $3,833 | $57,860 | $9,560 | $48,300 |
| 2015 | $3,479 | $57,860 | $9,560 | $48,300 |
| 2014 | $3,488 | $57,860 | $9,560 | $48,300 |
| 2013 | $1,811 | $60,900 | $10,045 | $50,855 |
Source: Public Records
Map
Nearby Homes
- 6495 Balsam Dr
- 6483 Borr Ave
- 834 Persimmon Place
- 6526 Borr Ave
- 6231 Peach Tree Rd
- 6258 Peach Tree Rd
- 6626 Red Fox Rd
- 0 Rosehill Rd
- 807 McNaughten Rd
- 6279 Braiden Ct Unit 10B
- 6737 Rocky Den Rd
- 696 Hunt Valley Dr
- 557 Woodingham Place Unit 1A
- 856 Cummington Rd
- 541 Woodingham Place Unit 2-C
- 6810 Prior Place
- 6840 Tanya Terrace
- 6849 Roundelay Rd N
- 6056 Naughten Pond Dr
- 6052 Naughten Pond Dr
- 1018 Lornaberry Ln
- 1038 Lornaberry Ln
- 1045 Brice Rd
- 1053 Brice Rd
- 1025 Brice Rd
- 1006 Lornaberry Ln
- 1054 Plum Ridge
- 1068 Plum Ridge
- 1015 Lornaberry Ln
- 1030 Plum Ridge
- 1013 Brice Rd
- 1080 Plum Ridge
- 992 Lornaberry Ln
- 1077 Brice Rd
- 1046 Brice Rd
- 1001 Lornaberry Ln
- 1001 Brice Rd
- 6366 Norfolk Dr
- 1014 Plum Ridge
- 1085 Brice Rd