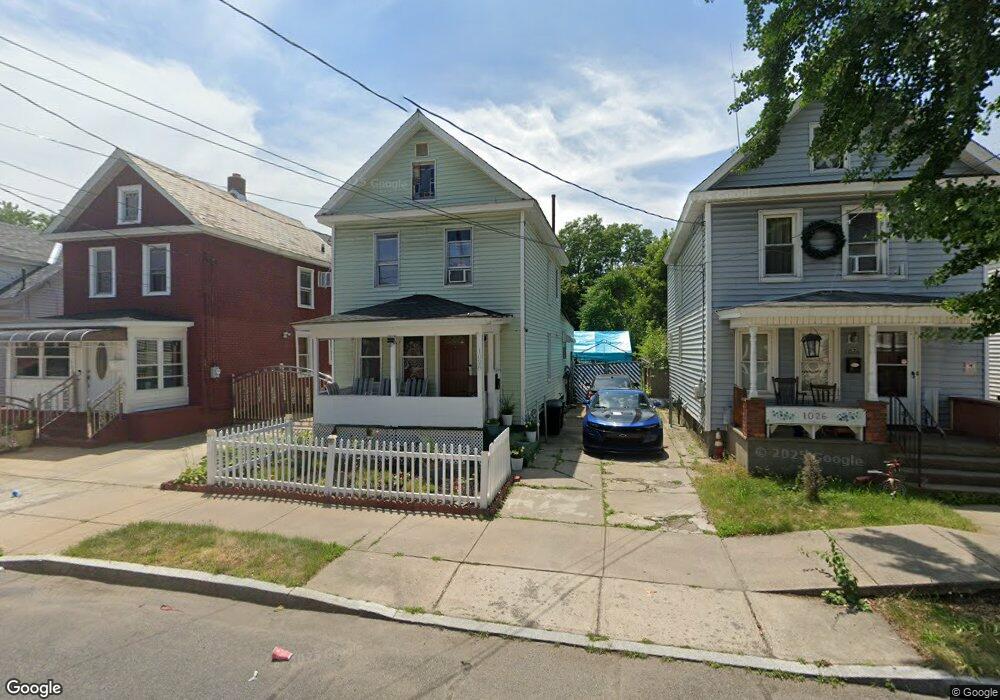
1028 Strong St Schenectady, NY 12307
Hamilton Hill NeighborhoodEstimated Value: $119,000 - $134,000
2
Beds
1
Bath
1,120
Sq Ft
$113/Sq Ft
Est. Value
About This Home
This home is located at 1028 Strong St, Schenectady, NY 12307 and is currently estimated at $126,429, approximately $112 per square foot. 1028 Strong St is a home located in Schenectady County with nearby schools including Martin Luther King School, Oneida Middle School, and Schenectady High School.
Ownership History
Date
Name
Owned For
Owner Type
Purchase Details
Closed on
Feb 23, 2011
Sold by
Chandra Rebecca I
Bought by
Kain Patrick A and Kain Drupattie
Current Estimated Value
Purchase Details
Closed on
Jan 3, 2008
Sold by
Manigault Ann
Bought by
Chandra Rebecca
Purchase Details
Closed on
Aug 1, 2002
Sold by
Schenectady City Of
Bought by
Manigault Ann
Purchase Details
Closed on
Oct 21, 1998
Purchase Details
Closed on
Aug 17, 1995
Sold by
O'Donnell Kevin Guido Joseph
Bought by
Ward Laurarene R
Purchase Details
Closed on
May 24, 1995
Sold by
Seiler Louis
Bought by
O'Donnell Kevin and Guido Joseph
Create a Home Valuation Report for This Property
The Home Valuation Report is an in-depth analysis detailing your home's value as well as a comparison with similar homes in the area
Home Values in the Area
Average Home Value in this Area
Purchase History
| Date | Buyer | Sale Price | Title Company |
|---|---|---|---|
| Kain Patrick A | $16,000 | None Available | |
| Chandra Rebecca | $3,000 | -- | |
| Manigault Ann | $1,000 | -- | |
| -- | $15,000 | -- | |
| Ward Laurarene R | $44,000 | -- | |
| O'Donnell Kevin | $20,500 | -- |
Source: Public Records
Tax History Compared to Growth
Tax History
| Year | Tax Paid | Tax Assessment Tax Assessment Total Assessment is a certain percentage of the fair market value that is determined by local assessors to be the total taxable value of land and additions on the property. | Land | Improvement |
|---|---|---|---|---|
| 2024 | $2,924 | $49,300 | $7,400 | $41,900 |
| 2023 | $2,835 | $49,300 | $7,400 | $41,900 |
| 2022 | $2,762 | $49,300 | $7,400 | $41,900 |
| 2021 | $2,741 | $49,300 | $7,400 | $41,900 |
| 2020 | $2,692 | $49,300 | $7,400 | $41,900 |
| 2019 | $1,671 | $49,300 | $7,400 | $41,900 |
| 2018 | $1,996 | $49,300 | $7,400 | $41,900 |
| 2017 | $1,673 | $49,300 | $7,400 | $41,900 |
| 2016 | $2,086 | $49,300 | $7,400 | $41,900 |
| 2015 | -- | $49,300 | $7,400 | $41,900 |
| 2014 | -- | $49,300 | $7,400 | $41,900 |
Source: Public Records
Map
Nearby Homes