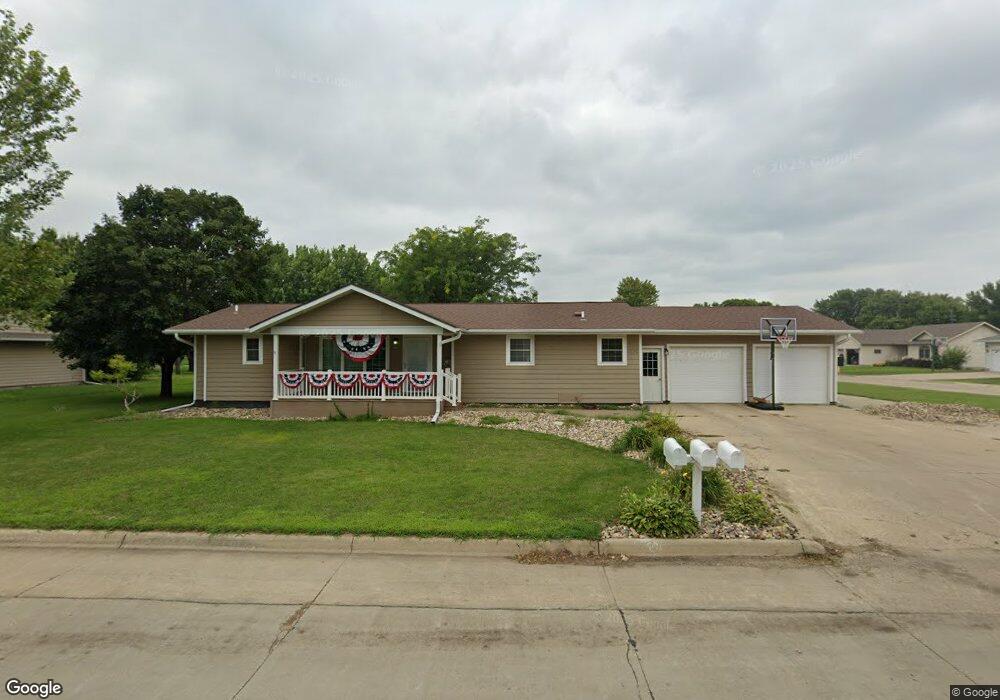
1029 13th St Rock Valley, IA 51247
Estimated Value: $181,000 - $292,000
--
Bed
2
Baths
1,438
Sq Ft
$168/Sq Ft
Est. Value
About This Home
This home is located at 1029 13th St, Rock Valley, IA 51247 and is currently estimated at $241,267, approximately $167 per square foot. 1029 13th St is a home located in Sioux County with nearby schools including Rock Valley Elementary School, Rock Valley Middle School, and Rock Valley Junior/Senior High School.
Ownership History
Date
Name
Owned For
Owner Type
Purchase Details
Closed on
Nov 11, 2022
Sold by
Vander Ziel Kenneth P and Vander Jolene C
Bought by
Vanveldhuizen Matthew W
Current Estimated Value
Home Financials for this Owner
Home Financials are based on the most recent Mortgage that was taken out on this home.
Original Mortgage
$260,865
Outstanding Balance
$252,966
Interest Rate
7.08%
Estimated Equity
-$11,699
Purchase Details
Closed on
Nov 24, 2020
Sold by
18 & 75 Leasing Llc
Bought by
Ziel Kenneth P Vander and Ziel Jolene C
Purchase Details
Closed on
May 30, 2018
Sold by
K & J Body Shio Inc
Bought by
Vanderziel Kenneth P and Vanderziel Jolene C
Purchase Details
Closed on
Jan 16, 2017
Sold by
Hallstrom Shirley F and Hallstrom Todd D
Bought by
Vander Ziel Kenneth P and Vander Ziel Jolene C
Create a Home Valuation Report for This Property
The Home Valuation Report is an in-depth analysis detailing your home's value as well as a comparison with similar homes in the area
Home Values in the Area
Average Home Value in this Area
Purchase History
| Date | Buyer | Sale Price | Title Company |
|---|---|---|---|
| Vanveldhuizen Matthew W | $255,000 | -- | |
| Vanveldhuizen Matthew W | $255,000 | None Listed On Document | |
| Ziel Kenneth P Vander | $96,500 | None Available | |
| Vanderziel Kenneth P | -- | -- | |
| Vander Ziel Kenneth P | -- | None Available | |
| Vander Ziel Kenneth P | -- | None Available |
Source: Public Records
Mortgage History
| Date | Status | Borrower | Loan Amount |
|---|---|---|---|
| Open | Vanveldhuizen Matthew W | $260,865 | |
| Closed | Vanveldhuizen Matthew W | $260,865 |
Source: Public Records
Tax History Compared to Growth
Tax History
| Year | Tax Paid | Tax Assessment Tax Assessment Total Assessment is a certain percentage of the fair market value that is determined by local assessors to be the total taxable value of land and additions on the property. | Land | Improvement |
|---|---|---|---|---|
| 2025 | $3,510 | $110,100 | $26,820 | $83,280 |
| 2024 | $3,510 | $230,380 | $26,820 | $203,560 |
| 2023 | $3,428 | $230,380 | $26,820 | $203,560 |
| 2022 | $2,970 | $187,340 | $26,820 | $160,520 |
| 2021 | $3,150 | $186,420 | $26,820 | $159,600 |
| 2020 | $3,150 | $177,220 | $26,820 | $150,400 |
| 2019 | $2,954 | $162,820 | $17,440 | $145,380 |
| 2018 | $2,752 | $162,820 | $17,440 | $145,380 |
| 2017 | $2,752 | $155,430 | $17,440 | $137,990 |
| 2014 | $2,360 | $133,450 | $0 | $0 |
Source: Public Records
Map
Nearby Homes