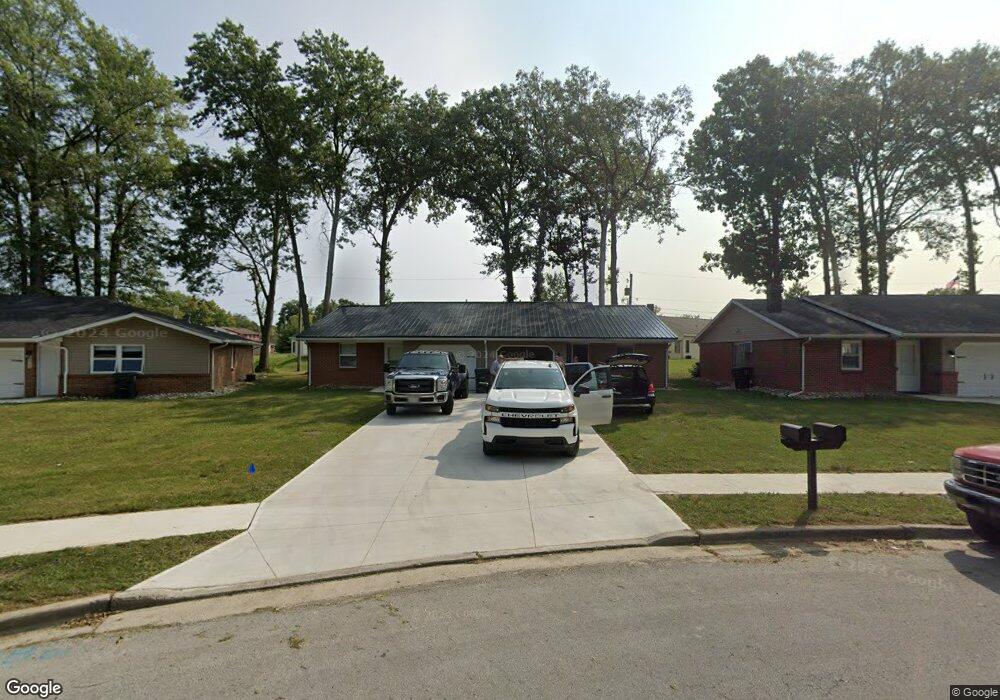
1029 Cameron Ln Lima, OH 45805
Lakewood West NeighborhoodEstimated Value: $154,000 - $291,000
4
Beds
2
Baths
1,678
Sq Ft
$139/Sq Ft
Est. Value
About This Home
This home is located at 1029 Cameron Ln, Lima, OH 45805 and is currently estimated at $232,437, approximately $138 per square foot. 1029 Cameron Ln is a home located in Allen County with nearby schools including Maplewood Elementary School, Elmwood Elementary School, and Shawnee Middle School.
Ownership History
Date
Name
Owned For
Owner Type
Purchase Details
Closed on
Nov 29, 2023
Sold by
Mostoller Ann
Bought by
Gearing Blaine and Gearing Michelle
Current Estimated Value
Home Financials for this Owner
Home Financials are based on the most recent Mortgage that was taken out on this home.
Original Mortgage
$395,250
Outstanding Balance
$350,859
Interest Rate
7.03%
Mortgage Type
Credit Line Revolving
Estimated Equity
-$118,422
Purchase Details
Closed on
Dec 20, 2007
Sold by
Obrien Mary Ann and Brandt Donald
Bought by
Brandt Donald
Purchase Details
Closed on
Jan 9, 1992
Bought by
Brandt Glenna Mae Trustee
Create a Home Valuation Report for This Property
The Home Valuation Report is an in-depth analysis detailing your home's value as well as a comparison with similar homes in the area
Home Values in the Area
Average Home Value in this Area
Purchase History
| Date | Buyer | Sale Price | Title Company |
|---|---|---|---|
| Gearing Blaine | $427,000 | None Listed On Document | |
| Brandt Donald | $81,500 | Attorney | |
| Brandt Glenna Mae Trustee | -- | -- |
Source: Public Records
Mortgage History
| Date | Status | Borrower | Loan Amount |
|---|---|---|---|
| Open | Gearing Blaine | $395,250 |
Source: Public Records
Tax History
| Year | Tax Paid | Tax Assessment Tax Assessment Total Assessment is a certain percentage of the fair market value that is determined by local assessors to be the total taxable value of land and additions on the property. | Land | Improvement |
|---|---|---|---|---|
| 2024 | $2,147 | $49,950 | $6,370 | $43,580 |
| 2023 | $2,808 | $37,280 | $4,760 | $32,520 |
| 2022 | $2,183 | $37,280 | $4,760 | $32,520 |
| 2021 | $2,244 | $37,280 | $4,760 | $32,520 |
| 2020 | $1,398 | $31,570 | $4,480 | $27,090 |
| 2019 | $1,398 | $31,570 | $4,480 | $27,090 |
| 2018 | $1,389 | $31,570 | $4,480 | $27,090 |
| 2017 | $1,422 | $31,570 | $4,480 | $27,090 |
| 2016 | $1,404 | $31,570 | $4,480 | $27,090 |
| 2015 | $1,389 | $31,570 | $4,480 | $27,090 |
| 2014 | $1,389 | $31,010 | $4,620 | $26,390 |
| 2013 | $1,362 | $31,010 | $4,620 | $26,390 |
Source: Public Records
Map
Nearby Homes
- 3071 Canterbury Dr
- 2964 Hanover Dr
- 2949 Lakewood Ave
- 250 Squire Ln
- 0 Springview Dr
- 2802 Lowell Ave
- 2700 Lowell Ave
- 3390 Spencerville Rd
- 1408 Winghaven Dr
- 206 Eagles Point St E
- 123 Eagles Point W
- 1421 Shawnee Rd
- XXXX Spencerville Rd
- 2072 Arcadia Ave
- 1453 W Shore Dr
- 1880 Wendell Ave
- 1409 Fulton Rd
- 161 S Cable Rd
- 145 N Concept Dr
- 2940 Koop Rd
- 1037 Cameron Ln
- 1021 Cameron Ln
- 2918 Wyngate Ct
- 1045 Cameron Ln
- 2914 Wyngate Ct
- 2917 Wyngate Ct
- 1044 Cameron Ln
- 3012 Clinton Way
- 1053 Cameron Ln
- 1052 Cameron Ln
- 2967 Canterbury Dr
- 3024 Clinton Way
- 2979 Canterbury Dr
- 1035 Esther Blvd
- 2913 Wyngate Ct
- 2910 Wyngate Ct
- 1061 Cameron Ln
- 2945 Canterbury Dr
- 1043 Esther Blvd
Your Personal Tour Guide
Ask me questions while you tour the home.