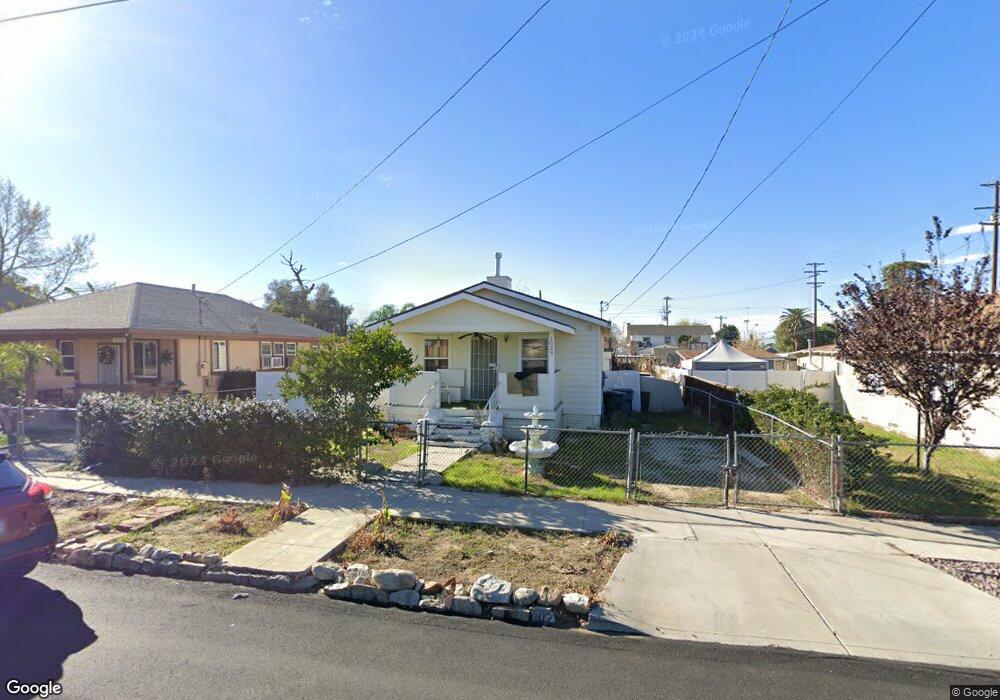
1029 Clay St Redlands, CA 92374
North Redlands NeighborhoodEstimated Value: $357,000 - $435,000
2
Beds
1
Bath
836
Sq Ft
$458/Sq Ft
Est. Value
About This Home
This home is located at 1029 Clay St, Redlands, CA 92374 and is currently estimated at $382,747, approximately $457 per square foot. 1029 Clay St is a home located in San Bernardino County with nearby schools including Kingsbury Elementary School, Moore Middle School, and Redlands East Valley High School.
Ownership History
Date
Name
Owned For
Owner Type
Purchase Details
Closed on
Nov 22, 2000
Sold by
Bushman Lisa Michelle
Bought by
Bushman Lisa Michelle
Current Estimated Value
Home Financials for this Owner
Home Financials are based on the most recent Mortgage that was taken out on this home.
Original Mortgage
$50,000
Outstanding Balance
$18,398
Interest Rate
7.86%
Estimated Equity
$364,349
Purchase Details
Closed on
Jul 5, 2000
Sold by
Shepard Verl
Bought by
Bushman Lisa Michelle
Create a Home Valuation Report for This Property
The Home Valuation Report is an in-depth analysis detailing your home's value as well as a comparison with similar homes in the area
Home Values in the Area
Average Home Value in this Area
Purchase History
| Date | Buyer | Sale Price | Title Company |
|---|---|---|---|
| Bushman Lisa Michelle | -- | American Title | |
| Bushman Lisa Michelle | $5,000 | -- |
Source: Public Records
Mortgage History
| Date | Status | Borrower | Loan Amount |
|---|---|---|---|
| Open | Bushman Lisa Michelle | $50,000 | |
| Closed | Bushman Lisa Michelle | $23,800 |
Source: Public Records
Tax History
| Year | Tax Paid | Tax Assessment Tax Assessment Total Assessment is a certain percentage of the fair market value that is determined by local assessors to be the total taxable value of land and additions on the property. | Land | Improvement |
|---|---|---|---|---|
| 2025 | $975 | $75,344 | $37,672 | $37,672 |
| 2024 | $913 | $73,866 | $36,933 | $36,933 |
| 2023 | $912 | $72,418 | $36,209 | $36,209 |
| 2022 | $900 | $70,998 | $35,499 | $35,499 |
| 2021 | $915 | $69,606 | $34,803 | $34,803 |
| 2020 | $902 | $68,892 | $34,446 | $34,446 |
| 2019 | $878 | $67,542 | $33,771 | $33,771 |
| 2018 | $857 | $66,218 | $33,109 | $33,109 |
| 2017 | $850 | $64,920 | $32,460 | $32,460 |
| 2016 | $841 | $63,648 | $31,824 | $31,824 |
| 2015 | $835 | $62,692 | $31,346 | $31,346 |
| 2014 | $821 | $61,464 | $30,732 | $30,732 |
Source: Public Records
Map
Nearby Homes
- 1203 Ohio St
- 1144 Orange St
- 903 Webster St
- 1024 Lawton St
- 1007 Lawton St
- 1003 Lawton St
- 926 Texas St
- 887 Carlotta Ct
- 323 E Colton Ave
- 838 W Brockton Ave
- 831 W Lugonia Ave
- 610 E Lugonia Ave Unit 4
- 915 Church St
- 853 Railway Ln
- 873 Railway Ln
- 848 Railway Ln
- 632 Church St
- 1510 Karon St
- 167 N Center St
- 163 N Center St
Your Personal Tour Guide
Ask me questions while you tour the home.