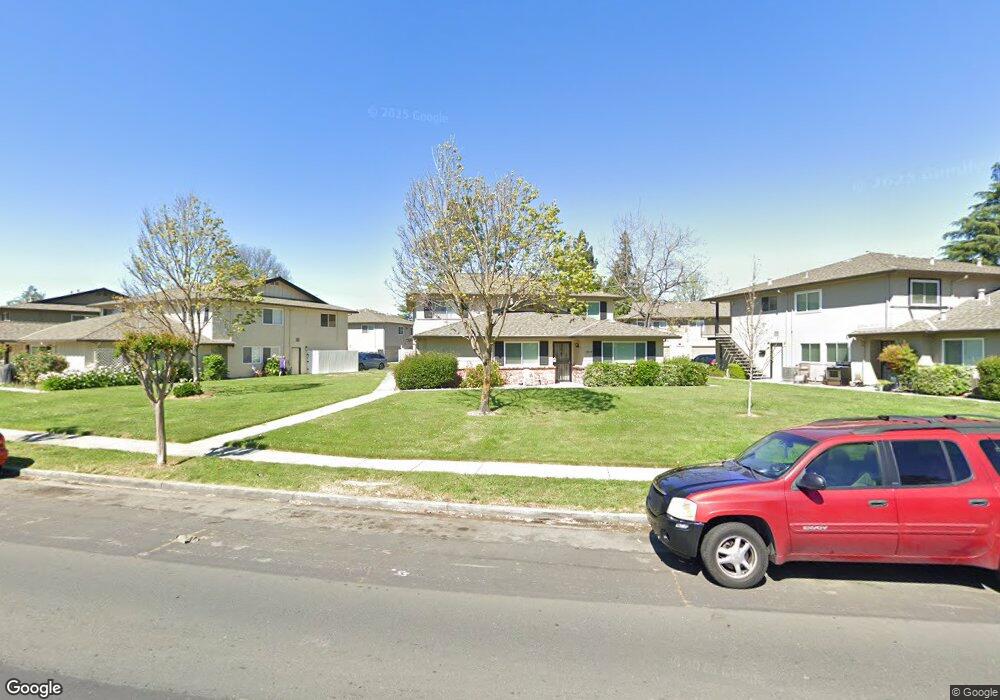
1029 Mohr Ln Unit 2 Concord, CA 94518
Tree Haven NeighborhoodEstimated Value: $315,000 - $445,000
2
Beds
2
Baths
877
Sq Ft
$411/Sq Ft
Est. Value
About This Home
This home is located at 1029 Mohr Ln Unit 2, Concord, CA 94518 and is currently estimated at $360,629, approximately $411 per square foot. 1029 Mohr Ln Unit 2 is a home located in Contra Costa County with nearby schools including Fair Oaks Elementary School, Oak Grove Middle School, and Ygnacio Valley High School.
Ownership History
Date
Name
Owned For
Owner Type
Purchase Details
Closed on
Apr 16, 2013
Sold by
Damele Richard
Bought by
Nevis Breanna Arlene
Current Estimated Value
Purchase Details
Closed on
Feb 23, 2004
Sold by
Occhipinti Todd and Occhipinti Holly
Bought by
Damele Richard
Purchase Details
Closed on
Aug 23, 2002
Sold by
Occhipinti Todd and Occhipinti Holly
Bought by
Occhipinti Todd and Occhipinti Holly
Home Financials for this Owner
Home Financials are based on the most recent Mortgage that was taken out on this home.
Original Mortgage
$130,000
Interest Rate
6.43%
Mortgage Type
Purchase Money Mortgage
Purchase Details
Closed on
Aug 19, 2000
Sold by
Brown Leslie D
Bought by
Occhipinti Todd and Rogers Holly
Home Financials for this Owner
Home Financials are based on the most recent Mortgage that was taken out on this home.
Original Mortgage
$124,303
Interest Rate
8.15%
Mortgage Type
FHA
Create a Home Valuation Report for This Property
The Home Valuation Report is an in-depth analysis detailing your home's value as well as a comparison with similar homes in the area
Home Values in the Area
Average Home Value in this Area
Purchase History
| Date | Buyer | Sale Price | Title Company |
|---|---|---|---|
| Nevis Breanna Arlene | -- | None Available | |
| Damele Richard | $220,000 | Fidelity National Title | |
| Occhipinti Todd | -- | First California Title Co | |
| Occhipinti Todd | $128,000 | First California Title Compa | |
| Brown Leslie D | -- | First California Title Compa |
Source: Public Records
Mortgage History
| Date | Status | Borrower | Loan Amount |
|---|---|---|---|
| Previous Owner | Occhipinti Todd | $130,000 | |
| Previous Owner | Occhipinti Todd | $124,303 |
Source: Public Records
Tax History
| Year | Tax Paid | Tax Assessment Tax Assessment Total Assessment is a certain percentage of the fair market value that is determined by local assessors to be the total taxable value of land and additions on the property. | Land | Improvement |
|---|---|---|---|---|
| 2025 | $4,363 | $312,774 | $177,715 | $135,059 |
| 2024 | $4,142 | $306,642 | $174,231 | $132,411 |
| 2023 | $4,142 | $300,630 | $170,815 | $129,815 |
| 2022 | $4,070 | $294,736 | $167,466 | $127,270 |
| 2021 | $3,956 | $288,958 | $164,183 | $124,775 |
| 2019 | $3,868 | $280,389 | $159,314 | $121,075 |
| 2018 | $3,712 | $274,892 | $156,191 | $118,701 |
| 2017 | $3,312 | $245,500 | $139,491 | $106,009 |
| 2016 | $2,971 | $220,000 | $125,002 | $94,998 |
| 2015 | $2,665 | $194,500 | $110,513 | $83,987 |
| 2014 | $2,360 | $170,000 | $96,592 | $73,408 |
Source: Public Records
Map
Nearby Homes
- 1049 Mohr Ln Unit A
- 1045 Mohr Ln Unit B
- 1040 Mohr Ln Unit C
- 1360 Del Rio Ct Unit 4
- 1044 Mohr Ln Unit D
- 1013 Mohr Ln Unit 2
- 1459 Del Rio Cir Unit C
- 1064 Mohr Ln Unit C
- 1387 Del Rio Cir Unit D
- 1369 Del Rio Cir Unit D
- 1369 Del Rio Cir Unit C
- 1023 Bermuda Dr
- 959 Chandler Ct
- 1078 Mohr Ln Unit A
- 1800 Gilardy Dr
- 2050 Monument Blvd
- 1218 Hookston Rd
- 130 Cleopatra Dr
- 1134 Lovell Ct
- 1035 Heckmann Ln
- 1029 Mohr Ln Unit 4
- 1029 Mohr Ln Unit 3
- 1029 Mohr Ln Unit 1
- 1039 Mohr Ln Unit D
- 1039 Mohr Ln Unit C
- 1039 Mohr Ln Unit B
- 1039 Mohr Ln Unit A
- 1025 Mohr Ln Unit 4
- 1025 Mohr Ln Unit 3
- 1025 Mohr Ln Unit 2
- 1025 Mohr Ln Unit 1
- 1041 Mohr Ln Unit D
- 1041 Mohr Ln Unit C
- 1041 Mohr Ln Unit B
- 1041 Mohr Ln Unit A
- 1037 Mohr Ln Unit D
- 1037 Mohr Ln Unit B
- 1037 Mohr Ln Unit A
- 1021 Mohr Ln Unit 4
- 1021 Mohr Ln Unit 3
Your Personal Tour Guide
Ask me questions while you tour the home.