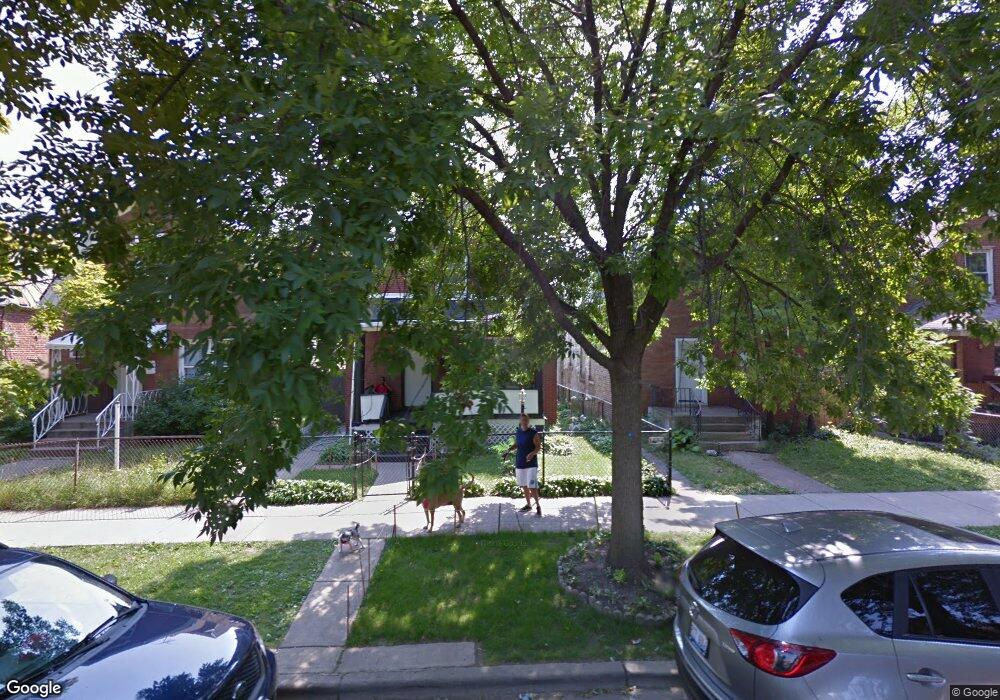
1029 N Karlov Ave Chicago, IL 60651
West Humboldt Park NeighborhoodEstimated Value: $266,942 - $324,000
2
Beds
1
Bath
920
Sq Ft
$320/Sq Ft
Est. Value
About This Home
This home is located at 1029 N Karlov Ave, Chicago, IL 60651 and is currently estimated at $294,647, approximately $320 per square foot. 1029 N Karlov Ave is a home located in Cook County with nearby schools including Brian Piccolo Elementary School, Orr Academy High School, and KIPP One Academy.
Ownership History
Date
Name
Owned For
Owner Type
Purchase Details
Closed on
Jul 26, 2002
Sold by
Rojan Jesus H and Rojan Juana
Bought by
Rojano Jesus H and Rojano Juana
Current Estimated Value
Home Financials for this Owner
Home Financials are based on the most recent Mortgage that was taken out on this home.
Original Mortgage
$96,000
Outstanding Balance
$41,058
Interest Rate
6.7%
Estimated Equity
$253,589
Purchase Details
Closed on
Sep 27, 2001
Sold by
Ford Tracy
Bought by
Rojan Jesus H and Rojan Juana
Purchase Details
Closed on
May 24, 1999
Sold by
Acosta Aurelio
Bought by
Ford Tracy R
Home Financials for this Owner
Home Financials are based on the most recent Mortgage that was taken out on this home.
Original Mortgage
$66,948
Interest Rate
6.92%
Mortgage Type
FHA
Purchase Details
Closed on
Jun 26, 1995
Sold by
Pioneer Bank & Trust Company
Bought by
Acosta Aurelio
Home Financials for this Owner
Home Financials are based on the most recent Mortgage that was taken out on this home.
Original Mortgage
$12,000
Interest Rate
7.51%
Create a Home Valuation Report for This Property
The Home Valuation Report is an in-depth analysis detailing your home's value as well as a comparison with similar homes in the area
Home Values in the Area
Average Home Value in this Area
Purchase History
| Date | Buyer | Sale Price | Title Company |
|---|---|---|---|
| Rojano Jesus H | -- | -- | |
| Rojan Jesus H | -- | -- | |
| Ford Tracy R | $67,500 | -- | |
| Acosta Aurelio | -- | -- |
Source: Public Records
Mortgage History
| Date | Status | Borrower | Loan Amount |
|---|---|---|---|
| Open | Rojano Jesus H | $96,000 | |
| Previous Owner | Ford Tracy R | $66,948 | |
| Previous Owner | Acosta Aurelio | $12,000 |
Source: Public Records
Tax History Compared to Growth
Tax History
| Year | Tax Paid | Tax Assessment Tax Assessment Total Assessment is a certain percentage of the fair market value that is determined by local assessors to be the total taxable value of land and additions on the property. | Land | Improvement |
|---|---|---|---|---|
| 2024 | $2,896 | $19,700 | $5,715 | $13,985 |
| 2023 | $2,793 | $17,000 | $4,572 | $12,428 |
| 2022 | $2,793 | $17,000 | $4,572 | $12,428 |
| 2021 | $2,749 | $17,000 | $4,572 | $12,428 |
| 2020 | $2,434 | $14,027 | $5,334 | $8,693 |
| 2019 | $2,478 | $15,761 | $5,334 | $10,427 |
| 2018 | $2,435 | $15,761 | $5,334 | $10,427 |
| 2017 | $2,036 | $12,831 | $4,762 | $8,069 |
| 2016 | $2,070 | $12,831 | $4,762 | $8,069 |
| 2015 | $2,148 | $14,343 | $4,762 | $9,581 |
| 2014 | $2,015 | $13,429 | $4,572 | $8,857 |
| 2013 | $1,964 | $13,429 | $4,572 | $8,857 |
Source: Public Records
Map
Nearby Homes
- 1047 N Kedvale Ave
- 1015 N Pulaski Rd
- 3945 W Augusta Blvd
- 647 N Harding Ave
- 937 N Kedvale Ave
- 919 N Karlov Ave
- 1011 N Keeler Ave
- 942 N Harding Ave
- 1110 N Springfield Ave
- 1141 N Harding Ave
- 1118 N Springfield Ave
- 4107 W Iowa St Unit 6
- 1051 N Springfield Ave
- 4049 W Crystal St
- 1005 N Springfield Ave
- 4029 W Crystal St Unit 1
- 4224 W Thomas St
- 905 N Harding Ave
- 833 N Keystone Ave
- 906 N Springfield Ave
- 1031 N Karlov Ave
- 1035 N Karlov Ave
- 1023 N Karlov Ave
- 1037 N Karlov Ave
- 1019 N Karlov Ave Unit 1
- 1019 N Karlov Ave
- 1041 N Karlov Ave
- 1017 N Karlov Ave
- 1024 N Keystone Ave Unit 1
- 1028 N Keystone Ave
- 1030 N Keystone Ave
- 1043 N Karlov Ave
- 1013 N Karlov Ave
- 1022 N Keystone Ave
- 1034 N Keystone Ave
- 1036 N Keystone Ave
- 1018 N Keystone Ave
- 1047 N Karlov Ave
- 1030 N Karlov Ave
- 1011 N Karlov Ave