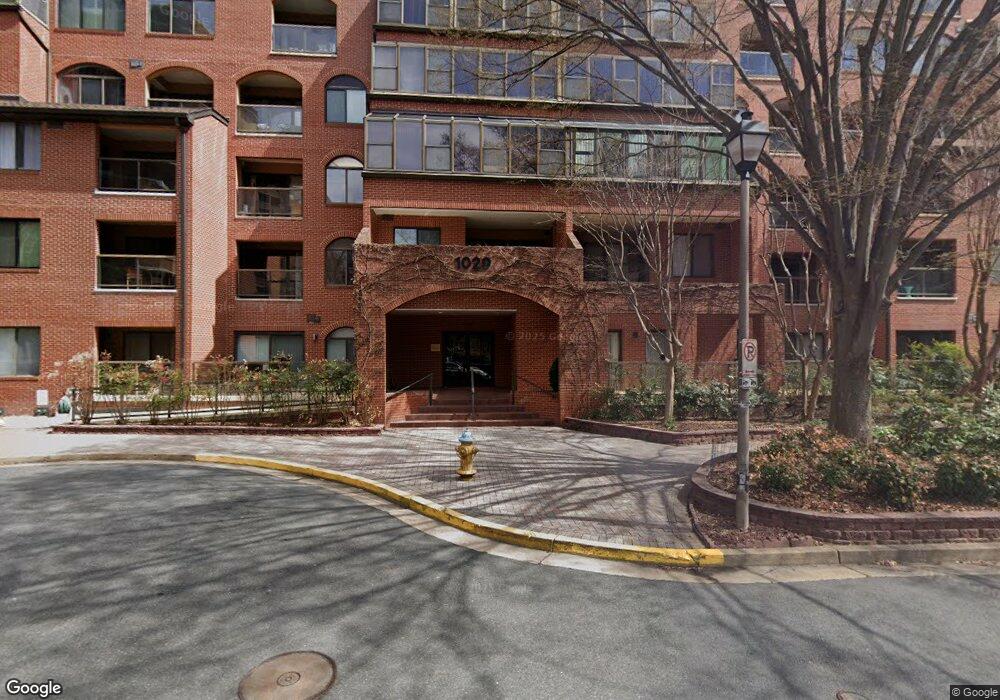
Summer Walk 1029 N Stuart St Unit 513 Arlington, VA 22201
Ballston NeighborhoodEstimated Value: $415,000 - $460,000
1
Bed
2
Baths
706
Sq Ft
$609/Sq Ft
Est. Value
About This Home
This home is located at 1029 N Stuart St Unit 513, Arlington, VA 22201 and is currently estimated at $429,673, approximately $608 per square foot. 1029 N Stuart St Unit 513 is a home located in Arlington County with nearby schools including Ashlawn Elementary School, Swanson Middle School, and Washington Liberty High School.
Ownership History
Date
Name
Owned For
Owner Type
Purchase Details
Closed on
Nov 28, 2007
Sold by
Battaglia Andrea M
Bought by
Genuino Arleen G R
Current Estimated Value
Home Financials for this Owner
Home Financials are based on the most recent Mortgage that was taken out on this home.
Original Mortgage
$314,910
Outstanding Balance
$201,172
Interest Rate
6.48%
Mortgage Type
New Conventional
Estimated Equity
$228,501
Purchase Details
Closed on
Sep 23, 2003
Sold by
Vecchiariello Victor
Bought by
Battaglia Andrea
Home Financials for this Owner
Home Financials are based on the most recent Mortgage that was taken out on this home.
Original Mortgage
$247,500
Interest Rate
6.31%
Mortgage Type
New Conventional
Purchase Details
Closed on
Apr 27, 1998
Sold by
Clark John S and Clark Barbara H
Bought by
Vecchiariello Victor J
Home Financials for this Owner
Home Financials are based on the most recent Mortgage that was taken out on this home.
Original Mortgage
$96,650
Interest Rate
7.11%
Mortgage Type
FHA
Create a Home Valuation Report for This Property
The Home Valuation Report is an in-depth analysis detailing your home's value as well as a comparison with similar homes in the area
Home Values in the Area
Average Home Value in this Area
Purchase History
| Date | Buyer | Sale Price | Title Company |
|---|---|---|---|
| Genuino Arleen G R | $349,900 | -- | |
| Battaglia Andrea | $275,000 | -- | |
| Vecchiariello Victor J | $99,500 | -- |
Source: Public Records
Mortgage History
| Date | Status | Borrower | Loan Amount |
|---|---|---|---|
| Open | Genuino Arleen G R | $314,910 | |
| Previous Owner | Vecchiariello Victor J | $247,500 | |
| Previous Owner | Vecchiariello Victor J | $96,650 |
Source: Public Records
Tax History Compared to Growth
Tax History
| Year | Tax Paid | Tax Assessment Tax Assessment Total Assessment is a certain percentage of the fair market value that is determined by local assessors to be the total taxable value of land and additions on the property. | Land | Improvement |
|---|---|---|---|---|
| 2025 | $4,192 | $405,800 | $61,400 | $344,400 |
| 2024 | $3,996 | $386,800 | $61,400 | $325,400 |
| 2023 | $4,051 | $393,300 | $61,400 | $331,900 |
| 2022 | $4,016 | $389,900 | $28,200 | $361,700 |
| 2021 | $4,016 | $389,900 | $28,200 | $361,700 |
| 2020 | $3,668 | $357,500 | $28,200 | $329,300 |
| 2019 | $3,602 | $351,100 | $28,200 | $322,900 |
| 2018 | $3,383 | $336,300 | $28,200 | $308,100 |
| 2017 | $3,383 | $336,300 | $28,200 | $308,100 |
| 2016 | $3,333 | $336,300 | $28,200 | $308,100 |
| 2015 | $3,047 | $305,900 | $28,200 | $277,700 |
| 2014 | $3,047 | $305,900 | $28,200 | $277,700 |
Source: Public Records
About Summer Walk
Map
Nearby Homes
- 1029 N Stuart St Unit 204
- 1044 N Stafford St
- 1050 N Stuart St Unit 701
- 4207 11th St N Unit 1
- 1055 N Stafford St
- 1000 N Randolph St Unit 806
- 1000 N Randolph St Unit 104
- 1050 N Taylor St Unit 1407
- 1050 N Taylor St Unit 1105
- 1050 N Taylor St Unit 1201
- 900 N Stafford St Unit 1117
- 900 N Stafford St Unit 2016
- 900 N Stafford St Unit 2632
- 1001 N Randolph St Unit 215
- 1045 N Utah St Unit 506
- 4103 11th Place N
- 1024 N Utah St Unit 524
- 1024 N Utah St Unit 116
- 1138 N Stafford St
- 1001 N Vermont St Unit 102
- 1029 N Stuart St Unit 304
- 1029 N Stuart St Unit 112
- 1029 N Stuart St Unit 714
- 1029 N Stuart St Unit 522
- 1029 N Stuart St Unit 506
- 1029 N Stuart St Unit 102
- 1029 N Stuart St Unit 413
- 1029 N Stuart St Unit 213
- 1029 N Stuart St Unit 502
- 1029 N Stuart St Unit 417
- 1029 N Stuart St Unit 515
- 1029 N Stuart St Unit 216
- 1029 N Stuart St Unit 520
- 1029 N Stuart St Unit 208
- 1029 N Stuart St Unit 510
- 1029 N Stuart St Unit 416
- 1029 N Stuart St Unit 708
- 1029 N Stuart St Unit 713
- 1029 N Stuart St Unit 205
- 1029 N Stuart St Unit 202