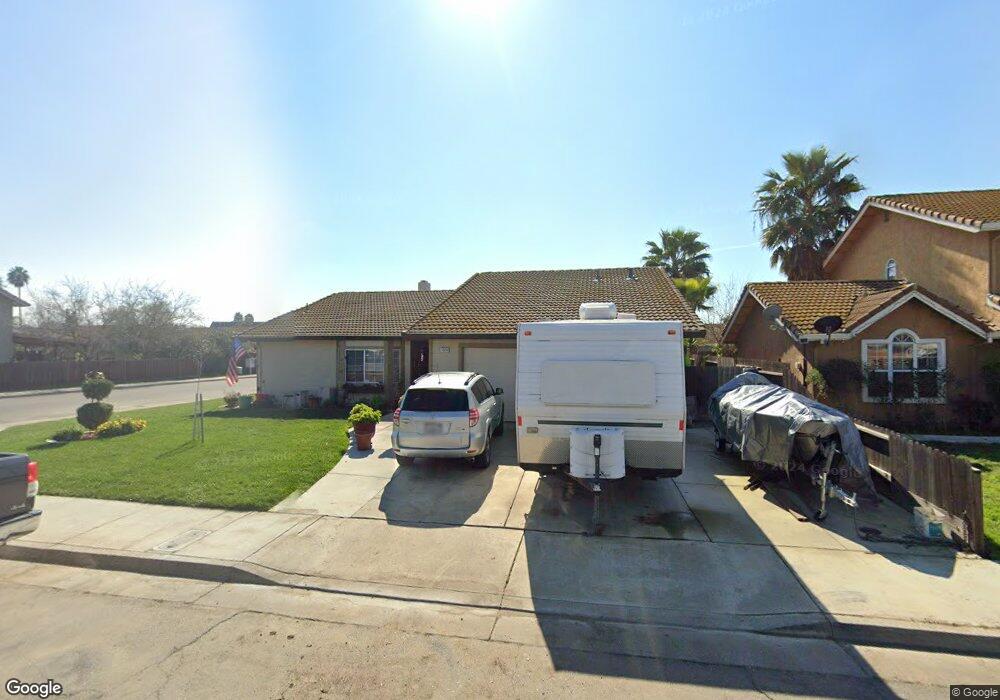
1029 Peachwood Ct Los Banos, CA 93635
Estimated Value: $403,000 - $427,569
3
Beds
2
Baths
1,547
Sq Ft
$271/Sq Ft
Est. Value
About This Home
This home is located at 1029 Peachwood Ct, Los Banos, CA 93635 and is currently estimated at $419,190, approximately $270 per square foot. 1029 Peachwood Ct is a home located in Merced County with nearby schools including R.M. Miano Elementary School, Los Banos Junior High School, and Pacheco High School.
Ownership History
Date
Name
Owned For
Owner Type
Purchase Details
Closed on
Jan 21, 2009
Sold by
The Bank Of New York
Bought by
Frugoli Albert and Frugoli Alice
Current Estimated Value
Home Financials for this Owner
Home Financials are based on the most recent Mortgage that was taken out on this home.
Original Mortgage
$98,910
Outstanding Balance
$61,613
Interest Rate
4.91%
Mortgage Type
VA
Estimated Equity
$357,577
Purchase Details
Closed on
Dec 18, 2008
Sold by
Iniguez Daniel
Bought by
The Bank Of New York
Home Financials for this Owner
Home Financials are based on the most recent Mortgage that was taken out on this home.
Original Mortgage
$98,910
Outstanding Balance
$61,613
Interest Rate
4.91%
Mortgage Type
VA
Estimated Equity
$357,577
Purchase Details
Closed on
Jun 23, 2006
Sold by
Peterson Nancy A
Bought by
Iniguez Daniel
Home Financials for this Owner
Home Financials are based on the most recent Mortgage that was taken out on this home.
Original Mortgage
$268,800
Interest Rate
6.89%
Mortgage Type
Purchase Money Mortgage
Purchase Details
Closed on
Feb 3, 2005
Sold by
Peterson Alfred Ray and Peterson Al
Bought by
Peterson Alfred Ray and Peterson Nancy A
Create a Home Valuation Report for This Property
The Home Valuation Report is an in-depth analysis detailing your home's value as well as a comparison with similar homes in the area
Home Values in the Area
Average Home Value in this Area
Purchase History
| Date | Buyer | Sale Price | Title Company |
|---|---|---|---|
| Frugoli Albert | $110,000 | First American Title Company | |
| The Bank Of New York | $94,860 | First American Title Company | |
| Iniguez Daniel | $336,000 | Chicago Title Co | |
| Peterson Alfred Ray | -- | -- |
Source: Public Records
Mortgage History
| Date | Status | Borrower | Loan Amount |
|---|---|---|---|
| Open | Frugoli Albert | $98,910 | |
| Previous Owner | Iniguez Daniel | $268,800 |
Source: Public Records
Tax History Compared to Growth
Tax History
| Year | Tax Paid | Tax Assessment Tax Assessment Total Assessment is a certain percentage of the fair market value that is determined by local assessors to be the total taxable value of land and additions on the property. | Land | Improvement |
|---|---|---|---|---|
| 2025 | $1,665 | $142,785 | $32,184 | $110,601 |
| 2024 | $1,665 | $139,986 | $31,553 | $108,433 |
| 2023 | $1,566 | $137,242 | $30,935 | $106,307 |
| 2022 | $1,530 | $134,552 | $30,329 | $104,223 |
| 2021 | $1,504 | $131,915 | $29,735 | $102,180 |
| 2020 | $1,481 | $130,564 | $29,431 | $101,133 |
| 2019 | $1,452 | $128,004 | $28,854 | $99,150 |
| 2018 | $1,407 | $125,495 | $28,289 | $97,206 |
| 2017 | $1,381 | $123,035 | $27,735 | $95,300 |
| 2016 | $1,380 | $119,545 | $27,192 | $92,353 |
| 2015 | $1,352 | $117,750 | $26,784 | $90,966 |
| 2014 | $1,308 | $115,445 | $26,260 | $89,185 |
Source: Public Records
Map
Nearby Homes
- 1007 Acaciawood Ct
- 947 Burlwood Ct
- 419 Stonewood Dr
- 644 Mendocino Ct
- 405 N Santa Ana St
- 675 Pinot Noir Ct
- 316 Rosalie Ct
- 1013 Chenin Blanc St
- 475 Santa Barbara St
- 436 N Mercey Springs Rd Unit 69
- 436 N Mercey Springs Rd Unit 16
- 436 N Mercey Springs Rd Unit 93
- 436 N Mercey Springs Rd Unit 154
- 543 N Mercey Springs Rd
- 1236 Santa Cruz Way
- 255 Birchwood Ave
- 418 Rockport Dr
- 450 Orange Ave
- 410 Orange Ave
- 204 North St
- 1025 Peachwood Ct
- 1032 Walnutwood Ct
- 1021 Peachwood Ct
- 1028 Walnutwood Ct
- 1033 Peachwood Ct
- 1036 Walnutwood Ct
- 1028 Peachwood Ct
- 1024 Peachwood Ct
- 1017 Peachwood Ct
- 1037 Peachwood Ct
- 1020 Peachwood Ct
- 1032 Peachwood Ct
- 1020 Walnutwood Ct
- 1040 Walnutwood Ct
- 1016 Peachwood Ct
- 1036 Peachwood Ct
- 1016 Walnutwood Ct
- 1027 Walnutwood Ct
- 1031 Acaciawood Ct
- 1041 Peachwood Ct