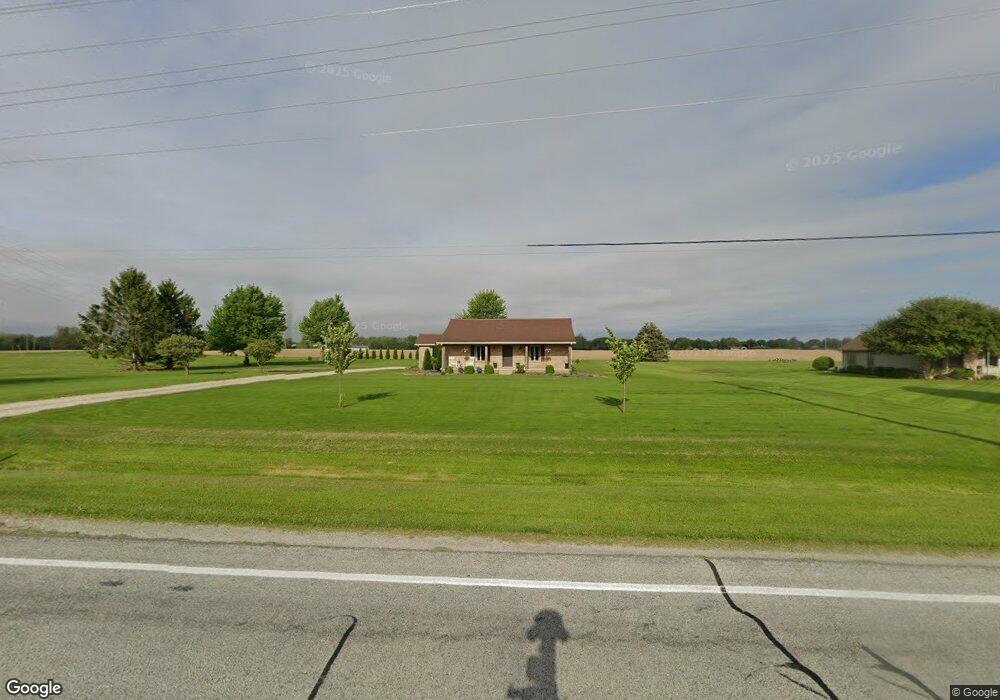
1029 S Maple St Greentown, IN 46936
Estimated Value: $250,000 - $264,000
3
Beds
2
Baths
1,568
Sq Ft
$164/Sq Ft
Est. Value
About This Home
This home is located at 1029 S Maple St, Greentown, IN 46936 and is currently estimated at $256,888, approximately $163 per square foot. 1029 S Maple St is a home located in Howard County with nearby schools including Eastern Elementary School and Eastern High School.
Ownership History
Date
Name
Owned For
Owner Type
Purchase Details
Closed on
Jun 21, 2022
Sold by
Howell Brandon M
Bought by
Obryan Wesley and Obryan Melissa K
Current Estimated Value
Home Financials for this Owner
Home Financials are based on the most recent Mortgage that was taken out on this home.
Original Mortgage
$188,237
Outstanding Balance
$179,831
Interest Rate
5.75%
Mortgage Type
FHA
Estimated Equity
$77,057
Purchase Details
Closed on
Oct 30, 2014
Sold by
Scott Timothy G
Bought by
Howell Brandon M
Create a Home Valuation Report for This Property
The Home Valuation Report is an in-depth analysis detailing your home's value as well as a comparison with similar homes in the area
Home Values in the Area
Average Home Value in this Area
Purchase History
| Date | Buyer | Sale Price | Title Company |
|---|---|---|---|
| Howell Brandon M | $144,500 | Moore Title & Escrow Inc | |
| Obryan Wesley | $245,000 | Maugans J Conrad |
Source: Public Records
Mortgage History
| Date | Status | Borrower | Loan Amount |
|---|---|---|---|
| Open | Obryan Wesley | $188,237 |
Source: Public Records
Tax History Compared to Growth
Tax History
| Year | Tax Paid | Tax Assessment Tax Assessment Total Assessment is a certain percentage of the fair market value that is determined by local assessors to be the total taxable value of land and additions on the property. | Land | Improvement |
|---|---|---|---|---|
| 2024 | $1,964 | $224,300 | $32,400 | $191,900 |
| 2022 | $1,536 | $187,900 | $32,400 | $155,500 |
| 2021 | $1,327 | $176,500 | $29,300 | $147,200 |
| 2020 | $963 | $158,000 | $29,300 | $128,700 |
| 2019 | $902 | $158,000 | $29,300 | $128,700 |
| 2018 | $728 | $146,900 | $29,300 | $117,600 |
| 2017 | $625 | $137,500 | $25,200 | $112,300 |
| 2016 | $547 | $133,700 | $25,200 | $108,500 |
| 2014 | $232 | $113,900 | $25,200 | $88,700 |
| 2013 | $912 | $121,400 | $25,200 | $96,200 |
Source: Public Records
Map
Nearby Homes
- 1009 Eastcrest Dr
- 1125 Robin Ct
- 312 S Meridian St
- 524 E Grant St
- 228 N Indiana St
- 228 E Railroad St
- 204 E Blaine St
- 329 W Grant St
- 405 N Green St
- 608 W Main St
- 128 W High St
- 408 W Payton St
- 7810 E 50 N
- 9391 E 100 N
- 8898,8924,8948 E 100 N
- 71 S 1100 E
- 8937 E 300 S
- 6936 Cassell Dr
- 36 Timberly Dr
- 567 Lakewood Ct