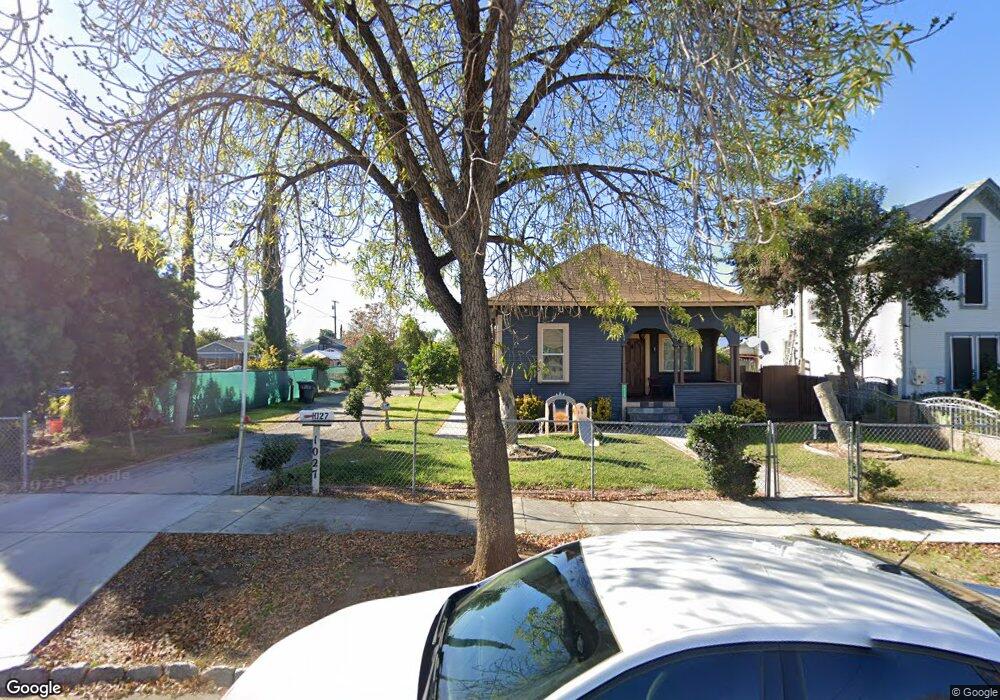
1029 Washington St Unit 1 Redlands, CA 92374
North Redlands NeighborhoodEstimated Value: $498,000 - $914,000
3
Beds
2
Baths
970
Sq Ft
$651/Sq Ft
Est. Value
About This Home
This home is located at 1029 Washington St Unit 1, Redlands, CA 92374 and is currently estimated at $631,426, approximately $650 per square foot. 1029 Washington St Unit 1 is a home located in San Bernardino County with nearby schools including Kingsbury Elementary School, Moore Middle School, and Redlands East Valley High School.
Ownership History
Date
Name
Owned For
Owner Type
Purchase Details
Closed on
Mar 27, 2018
Sold by
Driscoll Lori
Bought by
Driscoll Christopher L
Current Estimated Value
Purchase Details
Closed on
Mar 16, 2018
Sold by
Golden Group Investment & Services Llc
Bought by
Driscoll Christopher L
Purchase Details
Closed on
Nov 8, 2017
Sold by
Special Cipriano M Loera
Bought by
Golden Group Investment & Services Llc
Home Financials for this Owner
Home Financials are based on the most recent Mortgage that was taken out on this home.
Original Mortgage
$275,000
Interest Rate
3.94%
Mortgage Type
New Conventional
Purchase Details
Closed on
Feb 10, 2016
Sold by
Loera Eduardo H and Loera Edwardo H
Bought by
Ladd Aliciana and Estate Of Tiodola Wilson Madri
Create a Home Valuation Report for This Property
The Home Valuation Report is an in-depth analysis detailing your home's value as well as a comparison with similar homes in the area
Home Values in the Area
Average Home Value in this Area
Purchase History
| Date | Buyer | Sale Price | Title Company |
|---|---|---|---|
| Driscoll Christopher L | -- | Fidelity National Title Co | |
| Driscoll Christopher L | $487,500 | Fidelity National Title Comp | |
| Golden Group Investment & Services Llc | $307,000 | Fidelity National Title Co | |
| Ladd Aliciana | -- | None Available |
Source: Public Records
Mortgage History
| Date | Status | Borrower | Loan Amount |
|---|---|---|---|
| Previous Owner | Golden Group Investment & Services Llc | $275,000 |
Source: Public Records
Tax History Compared to Growth
Tax History
| Year | Tax Paid | Tax Assessment Tax Assessment Total Assessment is a certain percentage of the fair market value that is determined by local assessors to be the total taxable value of land and additions on the property. | Land | Improvement |
|---|---|---|---|---|
| 2025 | $6,474 | $554,692 | $166,122 | $388,570 |
| 2024 | $6,474 | $543,816 | $162,865 | $380,951 |
| 2023 | $6,466 | $533,153 | $159,672 | $373,481 |
| 2022 | $6,373 | $522,699 | $156,541 | $366,158 |
| 2021 | $6,489 | $512,450 | $153,472 | $358,978 |
| 2020 | $6,393 | $507,195 | $151,898 | $355,297 |
| 2019 | $6,214 | $497,250 | $148,920 | $348,330 |
| 2018 | $3,848 | $249,696 | $104,040 | $145,656 |
| 2017 | $3,120 | $244,800 | $102,000 | $142,800 |
| 2016 | $698 | $49,017 | $7,650 | $41,367 |
| 2015 | $605 | $48,281 | $7,535 | $40,746 |
| 2014 | $594 | $47,335 | $7,387 | $39,948 |
Source: Public Records
Map
Nearby Homes
- 1025 Clay St
- 932 6th St
- 1231 Webster St
- 834 Calhoun St
- 1218 6th St
- 1024 Lawton St
- 1324 Clay St
- 1007 Lawton St
- 527 Ruiz St
- 1312 Calhoun St
- 804 Tribune St
- 1117 Oxford Dr
- 1450 Washington St
- 843 Carlotta Ct
- 2167 Bergamot St
- 610 E Lugonia Ave Unit 4
- 1119 Church St
- 700 E Lugonia Ave
- 818 E Colton Ave
- 1510 Karon St
- 1029 Washington St
- 1033 Washington St
- 1017 Washington St
- 1015 Washington St
- 1028 Clay St
- 1018 Clay St
- 1034 Clay St
- 1101 Washington St
- 1009 Washington St
- 1012 Clay St
- 1024 Washington St
- 1022 Washington St
- 1026 Washington St
- 1016 Washington St
- 1102 Clay St
- 1107 Washington St
- 1005 Washigton St
- 1005 Washington St
- 1012 Washington St
- 1002 Clay St