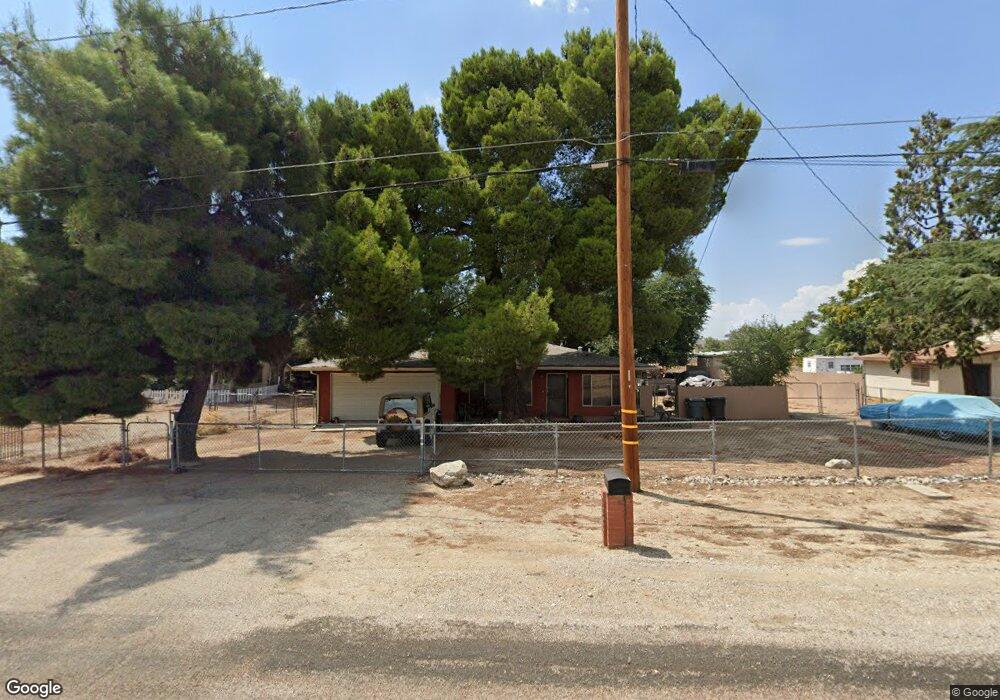
10295 Live Oak Ave Cherry Valley, CA 92223
Estimated Value: $410,000 - $503,000
3
Beds
1
Bath
1,122
Sq Ft
$416/Sq Ft
Est. Value
About This Home
This home is located at 10295 Live Oak Ave, Cherry Valley, CA 92223 and is currently estimated at $466,759, approximately $416 per square foot. 10295 Live Oak Ave is a home located in Riverside County with nearby schools including Brookside Elementary School, Mountain View Middle School, and Beaumont Senior High School.
Ownership History
Date
Name
Owned For
Owner Type
Purchase Details
Closed on
May 20, 2005
Sold by
Reich E Michael
Bought by
Reich Mary M
Current Estimated Value
Home Financials for this Owner
Home Financials are based on the most recent Mortgage that was taken out on this home.
Original Mortgage
$224,000
Outstanding Balance
$117,020
Interest Rate
5.87%
Mortgage Type
Fannie Mae Freddie Mac
Estimated Equity
$349,739
Purchase Details
Closed on
May 13, 2005
Sold by
Reich E Michael
Bought by
Gorham Faron T
Home Financials for this Owner
Home Financials are based on the most recent Mortgage that was taken out on this home.
Original Mortgage
$224,000
Outstanding Balance
$117,020
Interest Rate
5.87%
Mortgage Type
Fannie Mae Freddie Mac
Estimated Equity
$349,739
Create a Home Valuation Report for This Property
The Home Valuation Report is an in-depth analysis detailing your home's value as well as a comparison with similar homes in the area
Home Values in the Area
Average Home Value in this Area
Purchase History
| Date | Buyer | Sale Price | Title Company |
|---|---|---|---|
| Reich Mary M | -- | Financial Title Co San Berna | |
| Gorham Faron T | $280,000 | Financial Title Co San Berna | |
| Reich E Michael | -- | Financial Title Co San Berna | |
| Reich E Michael | -- | Financial Title Co San Berna |
Source: Public Records
Mortgage History
| Date | Status | Borrower | Loan Amount |
|---|---|---|---|
| Open | Gorham Faron T | $224,000 | |
| Closed | Gorham Faron T | $27,950 |
Source: Public Records
Tax History Compared to Growth
Tax History
| Year | Tax Paid | Tax Assessment Tax Assessment Total Assessment is a certain percentage of the fair market value that is determined by local assessors to be the total taxable value of land and additions on the property. | Land | Improvement |
|---|---|---|---|---|
| 2025 | $4,936 | $390,264 | $76,650 | $313,614 |
| 2023 | $4,936 | $375,112 | $73,675 | $301,437 |
| 2022 | $4,857 | $367,758 | $72,231 | $295,527 |
| 2021 | $4,164 | $315,533 | $62,387 | $253,146 |
| 2020 | $3,714 | $281,725 | $55,702 | $226,023 |
| 2019 | $3,618 | $273,520 | $54,080 | $219,440 |
| 2018 | $3,533 | $263,000 | $52,000 | $211,000 |
| 2017 | $3,314 | $246,000 | $48,000 | $198,000 |
| 2016 | $2,424 | $182,000 | $36,000 | $146,000 |
| 2015 | $1,960 | $148,000 | $29,000 | $119,000 |
| 2014 | $1,599 | $119,000 | $23,000 | $96,000 |
Source: Public Records
Map
Nearby Homes
- 10325 Live Oak Ave
- 0 Cherry Valley Blvd Unit OC25041579
- 10007 Beaumont Ave
- 39060 Cherry Valley Blvd Unit 65
- 10596 El Monte Dr
- 39407 Tokay St
- 0 Tokay St Unit EV22011453
- 9643 Avenida Miravilla
- 9575 Oak Glen Rd
- 601 Cypress St
- 10956 Cherry Ave
- 9643 Avenue San Timoteo
- 645 Bryce Ln
- 1322 Melstone St
- 717 Lions Lair Rd
- 1679 Stone Creek Rd
- 10543 Winesap Ave
- 10265 Nancy Ave
- 9870 Nancy Ave
- 1657 Stone Creek Rd
- 10269 Live Oak Ave
- 10337 Live Oak Ave
- 10341 Live Oak Ave
- 10255 Live Oak Ave
- 39477 Vineland St
- 39471 Vineland St
- 39461 Vineland St
- 10367 Live Oak Ave
- 2 Live Oak Ave Ave
- 4 Live Oak Ave
- 2 Live Oak Ave
- 3 Live Oak Ave
- 10241 Live Oak Ave
- 10369 Live Oak Ave
- 39512 Vineland St
- 10368 Live Oak Ave
- 39335 Vineland St Unit 162
- 39335 Vineland St Unit 117
- 39335 Vineland St Unit 159
- 39335 Vineland St Unit 131