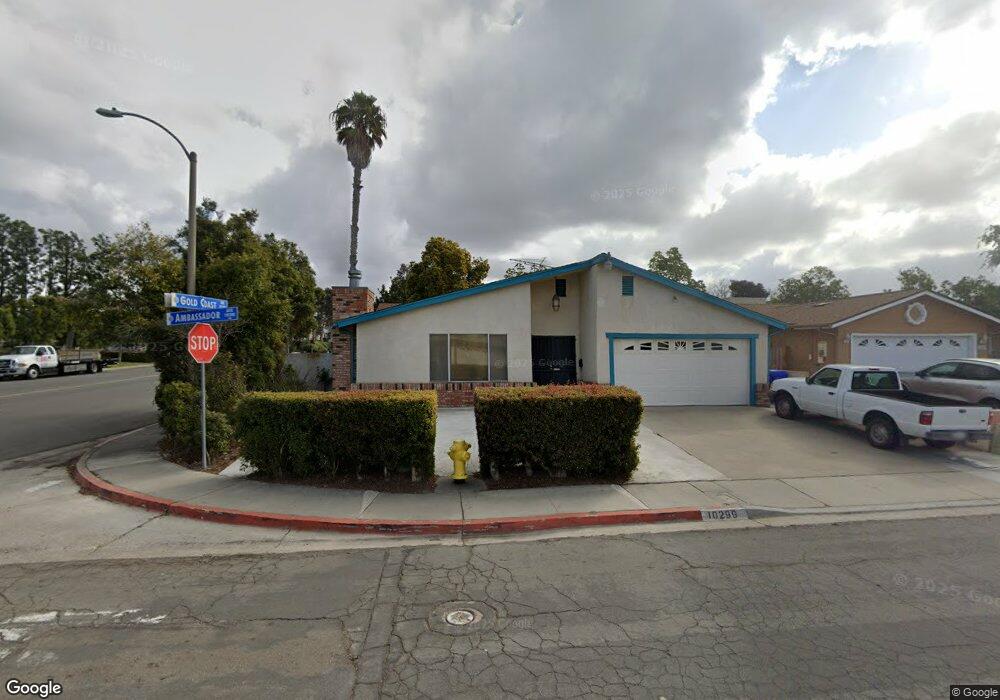
10299 Ambassador Ave San Diego, CA 92126
Mira Mesa NeighborhoodEstimated Value: $1,006,000 - $1,109,000
4
Beds
2
Baths
1,903
Sq Ft
$562/Sq Ft
Est. Value
About This Home
This home is located at 10299 Ambassador Ave, San Diego, CA 92126 and is currently estimated at $1,069,845, approximately $562 per square foot. 10299 Ambassador Ave is a home located in San Diego County with nearby schools including Jonas Salk Elementary School, Wangenheim Middle School, and Mira Mesa High School.
Ownership History
Date
Name
Owned For
Owner Type
Purchase Details
Closed on
Feb 1, 2022
Sold by
Woo Ken J
Bought by
Woo Ken J
Current Estimated Value
Home Financials for this Owner
Home Financials are based on the most recent Mortgage that was taken out on this home.
Original Mortgage
$110,000
Outstanding Balance
$88,773
Interest Rate
3.55%
Mortgage Type
New Conventional
Estimated Equity
$981,072
Purchase Details
Closed on
Jul 7, 2021
Sold by
Woo Mae Lin and Woo Marie Lin
Bought by
Woo Ken Jon
Purchase Details
Closed on
Oct 25, 2014
Sold by
Woo Ken Jo
Bought by
Woo Ken Jon and Woo Mae Lin
Purchase Details
Closed on
Dec 16, 2005
Sold by
Woo Choi Kam
Bought by
Woo Choi Kam and The Choi Kam Woo 2005 Trust
Purchase Details
Closed on
Apr 15, 2005
Sold by
Woo Ernie Jon
Bought by
Woo Ernie Jon and Woo Ken Jon
Purchase Details
Closed on
Mar 19, 2002
Sold by
Woo Choi Kam and Quon May Woo
Bought by
Woo Choi Kam
Purchase Details
Closed on
Sep 20, 1994
Sold by
Woo Chai Bo
Bought by
Woo Chai Bo
Create a Home Valuation Report for This Property
The Home Valuation Report is an in-depth analysis detailing your home's value as well as a comparison with similar homes in the area
Home Values in the Area
Average Home Value in this Area
Purchase History
| Date | Buyer | Sale Price | Title Company |
|---|---|---|---|
| Woo Ken J | -- | Lawyers Title | |
| Woo Ken J | -- | Lawyers Title | |
| Woo Ken Jon | $220,000 | None Available | |
| Woo Ken Jon | -- | None Available | |
| Woo Choi Kam | -- | -- | |
| Woo Ernie Jon | -- | -- | |
| Woo Choi Kam | -- | -- | |
| Woo Chai Bo | -- | -- | |
| Woo Chai Bo | -- | -- |
Source: Public Records
Mortgage History
| Date | Status | Borrower | Loan Amount |
|---|---|---|---|
| Open | Woo Ken J | $110,000 | |
| Closed | Woo Ken J | $110,000 |
Source: Public Records
Tax History Compared to Growth
Tax History
| Year | Tax Paid | Tax Assessment Tax Assessment Total Assessment is a certain percentage of the fair market value that is determined by local assessors to be the total taxable value of land and additions on the property. | Land | Improvement |
|---|---|---|---|---|
| 2025 | $3,118 | $540,386 | $390,969 | $149,417 |
| 2024 | $3,118 | $256,568 | $148,523 | $108,045 |
| 2023 | $3,046 | $251,538 | $145,611 | $105,927 |
| 2022 | $2,963 | $246,606 | $142,756 | $103,850 |
| 2021 | $2,940 | $241,771 | $139,957 | $101,814 |
| 2020 | $2,904 | $239,293 | $138,522 | $100,771 |
| 2019 | $2,851 | $234,602 | $135,806 | $98,796 |
| 2018 | $2,666 | $230,003 | $133,144 | $96,859 |
| 2017 | $2,597 | $225,494 | $130,534 | $94,960 |
| 2016 | $2,553 | $221,074 | $127,975 | $93,099 |
| 2015 | $2,515 | $217,754 | $126,053 | $91,701 |
| 2014 | $2,475 | $213,489 | $123,584 | $89,905 |
Source: Public Records
Map
Nearby Homes
- 10174 Camino Ruiz Unit 46
- 10166 Camino Ruiz Unit 32
- 8014 Hemphill Dr
- 10265 Eagle Rock Ave
- 7942 & 7944 Calico St
- 7971 Jade Coast Rd
- 14331 Montano Way
- 14633 Dunleer Way
- 14659 Dunleer Way
- 14641 Dunleer Way
- 14341 Montano Way
- 7857 Embry Point
- 10840 New Salem Point
- 8670 New Salem St Unit 106
- 8378 New Salem St Unit 24
- 8654 New Salem St Unit 44
- 8644 New Salem St Unit 6
- 10668 Dabney Dr Unit 122
- 10668 Dabney Dr Unit 125
- 10573 Caminito Flores
- 10291 Ambassador Ave
- 10283 Ambassador Ave
- 10296 Ambassador Ave
- 10290 Ambassador Ave
- 10277 Ambassador Ave
- 10284 Ambassador Ave
- 10278 Ambassador Ave
- 10269 Ambassador Ave
- 8185 Gold Coast Dr
- 10272 Ambassador Ave
- 10263 Tisha Cir
- 10263 Ambassador Ave
- 8177 Gold Coast Dr
- 10264 Ambassador Ave
- 10271 Tisha Cir
- 10255 Tisha Cir
- 10247 Ambassador Ave
- 10256 Ambassador Ave
- 8171 Gold Coast Dr
- 10247 Tisha Cir