Estimated Value: $105,000 - $150,000
6
Beds
2
Baths
2,364
Sq Ft
$56/Sq Ft
Est. Value
About This Home
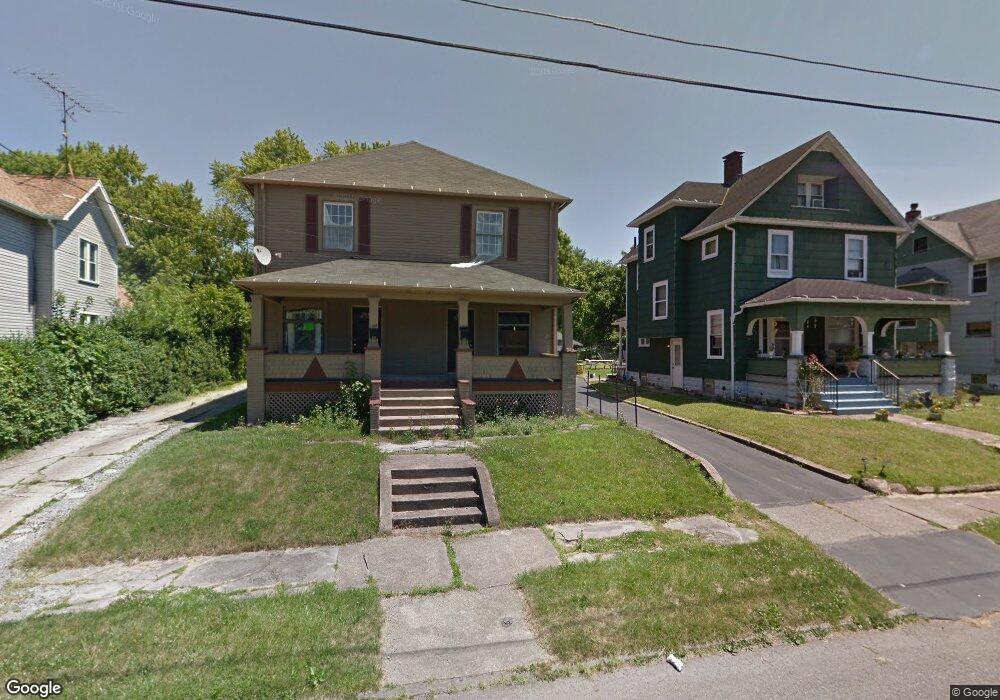
This home is located at 103 105 Fulton St, Niles, OH 44446 and is currently estimated at $131,776, approximately $55 per square foot. 103 105 Fulton St is a home located in Trumbull County with nearby schools including Niles Primary School, Niles Intermediate School, and Niles Middle School.
Ownership History
Date
Name
Owned For
Owner Type
Purchase Details
Closed on
Nov 7, 2017
Sold by
Kozup Peter E
Bought by
Wagner Mark V and Wagner Wendy A
Current Estimated Value
Purchase Details
Closed on
Jun 29, 2017
Sold by
Kozup Peter E
Bought by
Wagner Mark V
Home Financials for this Owner
Home Financials are based on the most recent Mortgage that was taken out on this home.
Original Mortgage
$40,000
Outstanding Balance
$33,351
Interest Rate
4.02%
Mortgage Type
Land Contract Argmt. Of Sale
Estimated Equity
$98,425
Purchase Details
Closed on
Jan 1, 1990
Sold by
Kozup Peter
Bought by
Peter E Kozup
Create a Home Valuation Report for This Property
The Home Valuation Report is an in-depth analysis detailing your home's value as well as a comparison with similar homes in the area
Home Values in the Area
Average Home Value in this Area
Purchase History
| Date | Buyer | Sale Price | Title Company |
|---|---|---|---|
| Wagner Mark V | $40,000 | American Land Title Agency | |
| Wagner Mark V | $100,000 | None Available | |
| Peter E Kozup | -- | -- |
Source: Public Records
Mortgage History
| Date | Status | Borrower | Loan Amount |
|---|---|---|---|
| Open | Wagner Mark V | $40,000 |
Source: Public Records
Tax History Compared to Growth
Tax History
| Year | Tax Paid | Tax Assessment Tax Assessment Total Assessment is a certain percentage of the fair market value that is determined by local assessors to be the total taxable value of land and additions on the property. | Land | Improvement |
|---|---|---|---|---|
| 2024 | $1,579 | $36,830 | $2,700 | $34,130 |
| 2023 | $1,579 | $24,020 | $2,700 | $21,320 |
| 2022 | $788 | $15,690 | $2,700 | $12,990 |
| 2021 | $827 | $15,690 | $2,700 | $12,990 |
| 2020 | $835 | $15,690 | $2,700 | $12,990 |
| 2019 | $810 | $14,500 | $2,700 | $11,800 |
| 2018 | $808 | $14,500 | $2,700 | $11,800 |
| 2017 | $804 | $14,500 | $2,700 | $11,800 |
| 2016 | $821 | $14,670 | $2,700 | $11,970 |
| 2015 | $812 | $14,670 | $2,700 | $11,970 |
| 2014 | $815 | $14,670 | $2,700 | $11,970 |
| 2013 | $859 | $16,320 | $2,700 | $13,620 |
Source: Public Records
Map
Nearby Homes