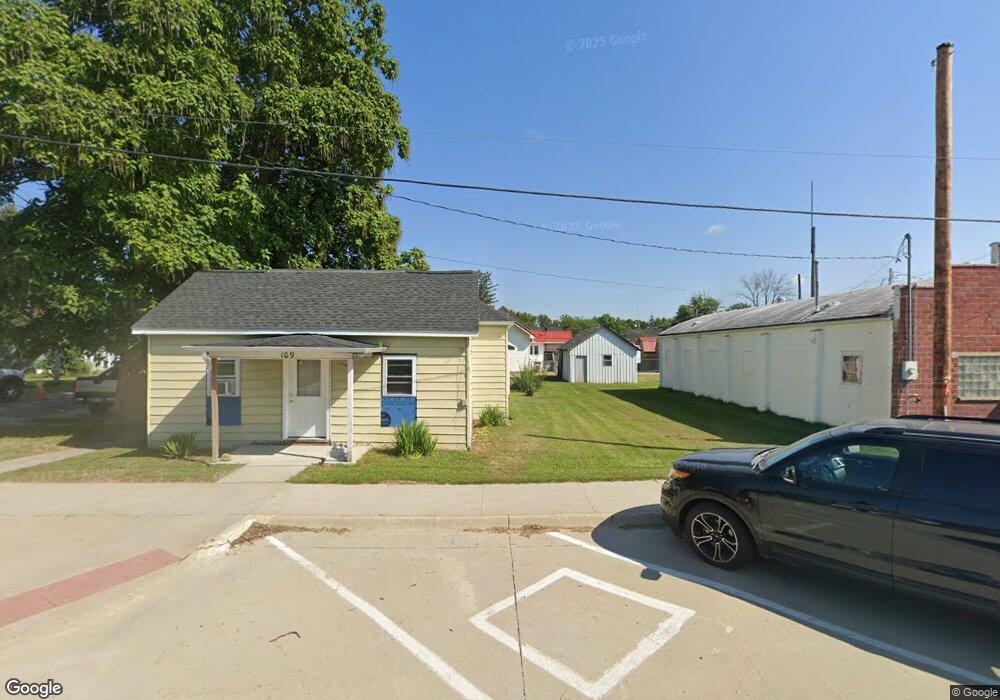
103 3rd St N Hazleton, IA 50641
Estimated Value: $73,000 - $96,000
1
Bed
2
Baths
703
Sq Ft
$114/Sq Ft
Est. Value
About This Home
This home is located at 103 3rd St N, Hazleton, IA 50641 and is currently estimated at $80,138, approximately $113 per square foot. 103 3rd St N is a home located in Buchanan County with nearby schools including Little Husky Learning Center, Wings Park Elementary School, and Parkside Elementary School.
Ownership History
Date
Name
Owned For
Owner Type
Purchase Details
Closed on
Jul 28, 2009
Sold by
Vanbrocklin John D
Bought by
Ackerson Barth A and Ackerson Connie A
Current Estimated Value
Home Financials for this Owner
Home Financials are based on the most recent Mortgage that was taken out on this home.
Original Mortgage
$25,600
Outstanding Balance
$16,928
Interest Rate
5.49%
Mortgage Type
New Conventional
Estimated Equity
$63,210
Purchase Details
Closed on
Dec 15, 2008
Sold by
Michels Brad
Bought by
Fidelity Bank And Trust
Create a Home Valuation Report for This Property
The Home Valuation Report is an in-depth analysis detailing your home's value as well as a comparison with similar homes in the area
Home Values in the Area
Average Home Value in this Area
Purchase History
| Date | Buyer | Sale Price | Title Company |
|---|---|---|---|
| Ackerson Barth A | $32,000 | None Available | |
| Fidelity Bank And Trust | $63,173 | None Available |
Source: Public Records
Mortgage History
| Date | Status | Borrower | Loan Amount |
|---|---|---|---|
| Open | Ackerson Barth A | $25,600 |
Source: Public Records
Tax History Compared to Growth
Tax History
| Year | Tax Paid | Tax Assessment Tax Assessment Total Assessment is a certain percentage of the fair market value that is determined by local assessors to be the total taxable value of land and additions on the property. | Land | Improvement |
|---|---|---|---|---|
| 2025 | $378 | $71,980 | $5,870 | $66,110 |
| 2024 | $378 | $55,910 | $5,240 | $50,670 |
| 2023 | $462 | $55,910 | $5,240 | $50,670 |
| 2022 | $540 | $41,620 | $4,160 | $37,460 |
| 2021 | $520 | $41,620 | $4,160 | $37,460 |
| 2020 | $520 | $39,060 | $3,780 | $35,280 |
| 2019 | $412 | $39,060 | $3,780 | $35,280 |
| 2018 | $386 | $33,600 | $3,780 | $29,820 |
| 2017 | $474 | $33,600 | $3,780 | $29,820 |
| 2016 | $400 | $37,770 | $3,750 | $34,020 |
| 2015 | $400 | $35,570 | $3,750 | $31,820 |
| 2014 | $306 | $29,890 | $3,750 | $26,140 |
Source: Public Records
Map
Nearby Homes
- 106 Madison St S
- 207 1st St N
- 104 Monroe St S
- 201 Westline Dr
- 1894 105th St
- 1836 105th St
- 0 S Frederick & Wildwood Ln Unit NBR20254283
- 00 Q Ave
- 0 Q Ave
- 1128 1st Ave SW
- 973 S Frederick Ave
- 919 1st Ave SE
- 825 1st Ave SW
- 720 S Frederick Ave
- 719 S Frederick Ave
- 817 7th St SE
- 418 7th Ave SE
- 0 Parcel: 1822126038 Unit NBR20254735
- 0 Parcel: 1822126035 Unit NBR20254717
- 229 4th Ave SE