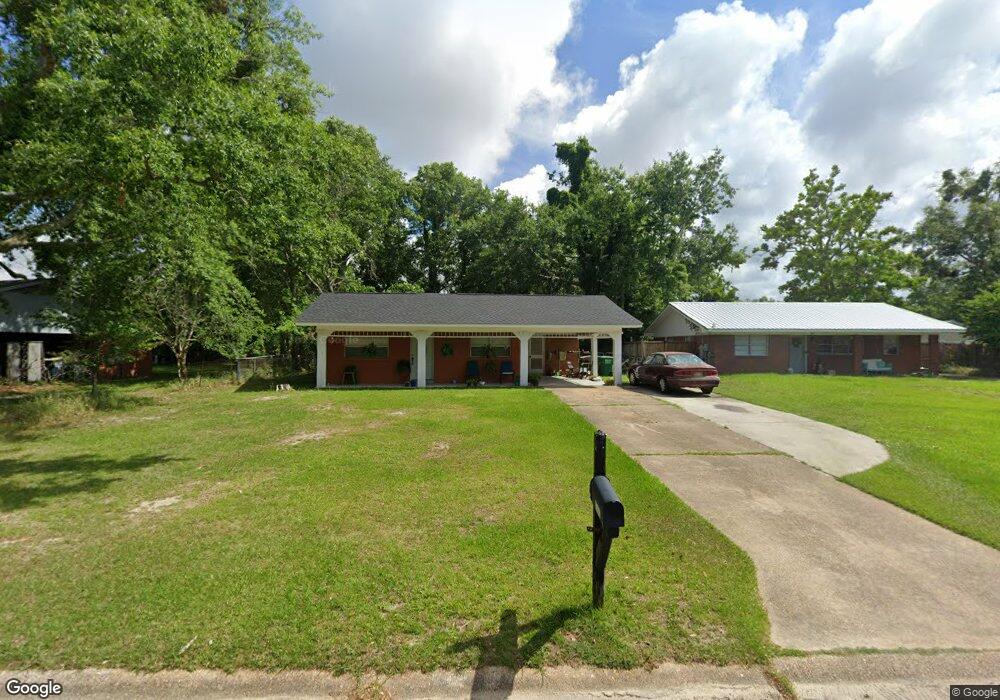
103 Bryant St Ocean Springs, MS 39564
Estimated Value: $157,042 - $177,000
--
Bed
2
Baths
1,064
Sq Ft
$160/Sq Ft
Est. Value
About This Home
This home is located at 103 Bryant St, Ocean Springs, MS 39564 and is currently estimated at $170,761, approximately $160 per square foot. 103 Bryant St is a home located in Jackson County with nearby schools including Magnolia Park Elementary School, Ocean Springs Middle School, and Ocean Springs High School.
Ownership History
Date
Name
Owned For
Owner Type
Purchase Details
Closed on
Dec 4, 2015
Sold by
Rice Amanda and Frankum Amanda
Bought by
Walker Pat and Walker Rickey
Current Estimated Value
Home Financials for this Owner
Home Financials are based on the most recent Mortgage that was taken out on this home.
Original Mortgage
$88,369
Outstanding Balance
$69,604
Interest Rate
3.75%
Mortgage Type
FHA
Estimated Equity
$101,157
Create a Home Valuation Report for This Property
The Home Valuation Report is an in-depth analysis detailing your home's value as well as a comparison with similar homes in the area
Home Values in the Area
Average Home Value in this Area
Purchase History
| Date | Buyer | Sale Price | Title Company |
|---|---|---|---|
| Walker Pat | -- | Pilger Title |
Source: Public Records
Mortgage History
| Date | Status | Borrower | Loan Amount |
|---|---|---|---|
| Open | Walker Pat | $88,369 |
Source: Public Records
Tax History Compared to Growth
Tax History
| Year | Tax Paid | Tax Assessment Tax Assessment Total Assessment is a certain percentage of the fair market value that is determined by local assessors to be the total taxable value of land and additions on the property. | Land | Improvement |
|---|---|---|---|---|
| 2024 | $611 | $5,905 | $1,394 | $4,511 |
| 2023 | $611 | $5,905 | $1,394 | $4,511 |
| 2022 | $617 | $5,866 | $1,394 | $4,472 |
| 2021 | $612 | $5,921 | $1,394 | $4,527 |
| 2020 | $487 | $4,631 | $1,143 | $3,488 |
| 2019 | $485 | $4,631 | $1,143 | $3,488 |
| 2018 | $484 | $4,690 | $1,143 | $3,547 |
| 2017 | $484 | $4,690 | $1,143 | $3,547 |
| 2016 | $470 | $4,690 | $1,143 | $3,547 |
| 2015 | $847 | $39,270 | $11,430 | $27,840 |
| 2014 | $848 | $5,938 | $1,715 | $4,223 |
| 2013 | $1,219 | $8,731 | $2,336 | $6,395 |
Source: Public Records
Map
Nearby Homes