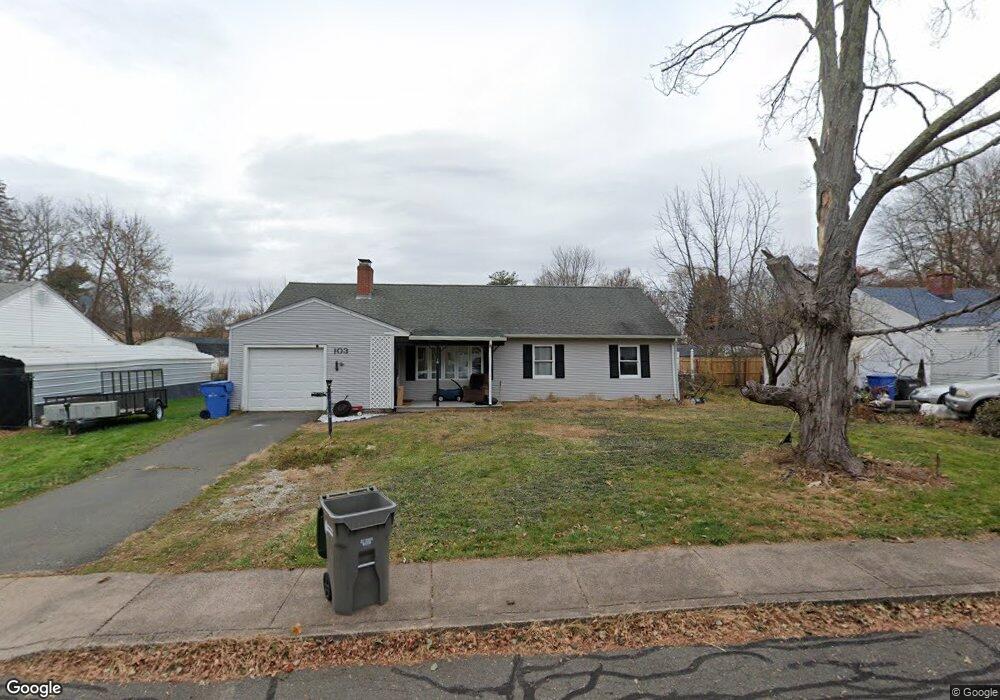
103 Conway Rd Manchester, CT 06042
Buckley District NeighborhoodEstimated Value: $292,000 - $344,000
3
Beds
1
Bath
1,414
Sq Ft
$221/Sq Ft
Est. Value
About This Home
This home is located at 103 Conway Rd, Manchester, CT 06042 and is currently estimated at $312,585, approximately $221 per square foot. 103 Conway Rd is a home located in Hartford County with nearby schools including Buckley School, Illing Middle School, and Elisabeth M. Bennet Academy.
Ownership History
Date
Name
Owned For
Owner Type
Purchase Details
Closed on
Nov 20, 2000
Sold by
Schober Michael
Bought by
Chakalos-Rouss Valerie
Current Estimated Value
Home Financials for this Owner
Home Financials are based on the most recent Mortgage that was taken out on this home.
Original Mortgage
$115,000
Outstanding Balance
$42,073
Interest Rate
7.78%
Estimated Equity
$270,512
Purchase Details
Closed on
Sep 24, 1987
Sold by
Ruis Robin Ann
Bought by
Johns Samuel D
Create a Home Valuation Report for This Property
The Home Valuation Report is an in-depth analysis detailing your home's value as well as a comparison with similar homes in the area
Home Values in the Area
Average Home Value in this Area
Purchase History
| Date | Buyer | Sale Price | Title Company |
|---|---|---|---|
| Chakalos-Rouss Valerie | $157,000 | -- | |
| Chakalos-Rouss Valerie | $157,000 | -- | |
| Johns Samuel D | $110,000 | -- |
Source: Public Records
Mortgage History
| Date | Status | Borrower | Loan Amount |
|---|---|---|---|
| Closed | Johns Samuel D | $48,000 | |
| Closed | Johns Samuel D | $50,000 | |
| Open | Johns Samuel D | $115,000 | |
| Closed | Johns Samuel D | $115,000 |
Source: Public Records
Tax History
| Year | Tax Paid | Tax Assessment Tax Assessment Total Assessment is a certain percentage of the fair market value that is determined by local assessors to be the total taxable value of land and additions on the property. | Land | Improvement |
|---|---|---|---|---|
| 2025 | $5,400 | $135,600 | $39,800 | $95,800 |
| 2024 | $5,245 | $135,600 | $39,800 | $95,800 |
| 2023 | $5,044 | $135,600 | $39,800 | $95,800 |
| 2022 | $4,898 | $135,600 | $39,800 | $95,800 |
| 2021 | $4,608 | $109,900 | $34,200 | $75,700 |
| 2020 | $4,602 | $109,900 | $34,200 | $75,700 |
| 2019 | $4,583 | $109,900 | $34,200 | $75,700 |
| 2018 | $4,496 | $109,900 | $34,200 | $75,700 |
| 2017 | $4,369 | $109,900 | $34,200 | $75,700 |
| 2016 | $4,587 | $115,600 | $43,300 | $72,300 |
| 2015 | $4,555 | $115,600 | $43,300 | $72,300 |
| 2014 | $4,468 | $115,600 | $43,300 | $72,300 |
Source: Public Records
Map
Nearby Homes
- 594 E Center St Unit G
- 39 Alice Dr
- 16 Coleman Rd
- 74 Overlook Dr
- 143 Boulder Rd
- 52 Gerard St
- 85 Lydall St
- 4 Buckingham St
- 49 Cliffside Dr Unit B
- 257 Green Rd
- 9 Robin Rd
- 86 Doane St
- 266 Knollwood Rd
- 600 Lydall St
- 85 Benton St
- 85 Henry St
- 46 Green Rd
- 121 Grandview St
- 195 Oakland St Unit A
- 105 Cidermill Rd
Your Personal Tour Guide
Ask me questions while you tour the home.