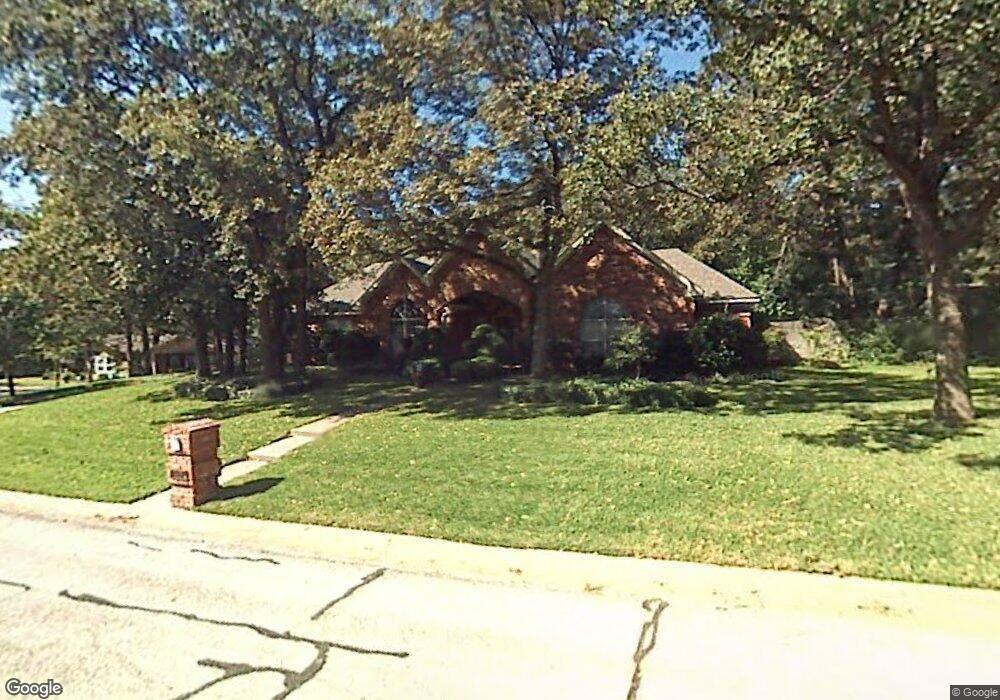
103 Cross Creek Dr Grapevine, TX 76051
Estimated Value: $513,000 - $619,000
3
Beds
2
Baths
1,991
Sq Ft
$293/Sq Ft
Est. Value
About This Home
This home is located at 103 Cross Creek Dr, Grapevine, TX 76051 and is currently estimated at $583,977, approximately $293 per square foot. 103 Cross Creek Dr is a home located in Tarrant County with nearby schools including Cannon Elementary School, Grapevine Middle, and Grapevine High School.
Ownership History
Date
Name
Owned For
Owner Type
Purchase Details
Closed on
Sep 27, 2013
Sold by
Sacco Lori L
Bought by
Waldeck James P and Waldeck Susan E
Current Estimated Value
Home Financials for this Owner
Home Financials are based on the most recent Mortgage that was taken out on this home.
Original Mortgage
$145,000
Outstanding Balance
$38,176
Interest Rate
4.46%
Mortgage Type
New Conventional
Estimated Equity
$545,801
Purchase Details
Closed on
Feb 7, 2006
Sold by
Sacco Christopher A
Bought by
Sacco Lori L
Purchase Details
Closed on
Feb 10, 2000
Sold by
Mcgaugh Tommy Ray and Mcgaugh Sarah Jean
Bought by
Sacco Christopher A and Sacco Lori L
Home Financials for this Owner
Home Financials are based on the most recent Mortgage that was taken out on this home.
Original Mortgage
$143,200
Interest Rate
8.19%
Purchase Details
Closed on
Nov 14, 1996
Sold by
Burton Bryan K
Bought by
Mcgaugh Tommy R and Mcgaugh Sarah
Create a Home Valuation Report for This Property
The Home Valuation Report is an in-depth analysis detailing your home's value as well as a comparison with similar homes in the area
Home Values in the Area
Average Home Value in this Area
Purchase History
| Date | Buyer | Sale Price | Title Company |
|---|---|---|---|
| Waldeck James P | -- | Lt | |
| Sacco Lori L | -- | None Available | |
| Sacco Christopher A | -- | Southwest Land Title | |
| Mcgaugh Tommy R | -- | Fidelity National Title Agen |
Source: Public Records
Mortgage History
| Date | Status | Borrower | Loan Amount |
|---|---|---|---|
| Open | Waldeck James P | $145,000 | |
| Previous Owner | Sacco Christopher A | $143,200 | |
| Closed | Sacco Lori L | $0 |
Source: Public Records
Tax History Compared to Growth
Tax History
| Year | Tax Paid | Tax Assessment Tax Assessment Total Assessment is a certain percentage of the fair market value that is determined by local assessors to be the total taxable value of land and additions on the property. | Land | Improvement |
|---|---|---|---|---|
| 2025 | $1,870 | $497,259 | $110,942 | $386,317 |
| 2024 | $1,870 | $609,442 | $110,942 | $498,500 |
| 2023 | $7,000 | $517,739 | $78,000 | $439,739 |
| 2022 | $7,520 | $379,588 | $78,000 | $301,588 |
| 2021 | $7,825 | $359,863 | $78,000 | $281,863 |
| 2020 | $7,959 | $361,862 | $78,000 | $283,862 |
| 2019 | $7,593 | $363,861 | $78,000 | $285,861 |
| 2018 | $1,799 | $302,686 | $78,000 | $224,686 |
| 2017 | $6,364 | $392,492 | $78,000 | $314,492 |
| 2016 | $5,785 | $250,154 | $78,000 | $172,154 |
| 2015 | $5,725 | $265,900 | $25,000 | $240,900 |
| 2014 | $5,725 | $265,900 | $25,000 | $240,900 |
Source: Public Records
Map
Nearby Homes
- 517 Yellowstone Dr
- 2217 Cameron Crossing
- 2221 Churchill Loop
- 1801 Fern Ct
- 2140 S Winding Creek Dr
- 2081 Holt Way
- 2092 Holt Way
- 1707 Overlook Dr
- 1024 Woodbriar Dr
- 2410 Bowie Ln
- 841 Meadow Bend Loop W
- 1508 Bennington Ct
- 521 Austin Oaks Dr
- 1002 Meadow Bend Loop N
- 1916 Everglade Ct
- 831 Simmons Ct
- 6007 Laurel Ln
- 6011 Laurel Ln
- 1092 Rosewood Dr
- 460 Caviness Dr
- 100 Cross Creek Dr
- 104 Cross Creek Dr
- 101 Cross Creek Dr
- 124 Manor Way St
- 105 Cross Creek Dr
- 136 Manor Way St
- 106 Cross Creek Dr
- 129 Manor Way St
- 101 Manor Way St
- 137 Manor Way St
- 109 Cross Creek Dr
- 108 Cross Creek Dr
- 1650 W Northwest Hwy
- 1940 W Northwest Hwy
- 116 Brookside Dr
- 147 Manor Way St
- 202 Brookside Dr
- 156 Manor Way St
- 208 Brookside Dr
- 108 Brookside Dr