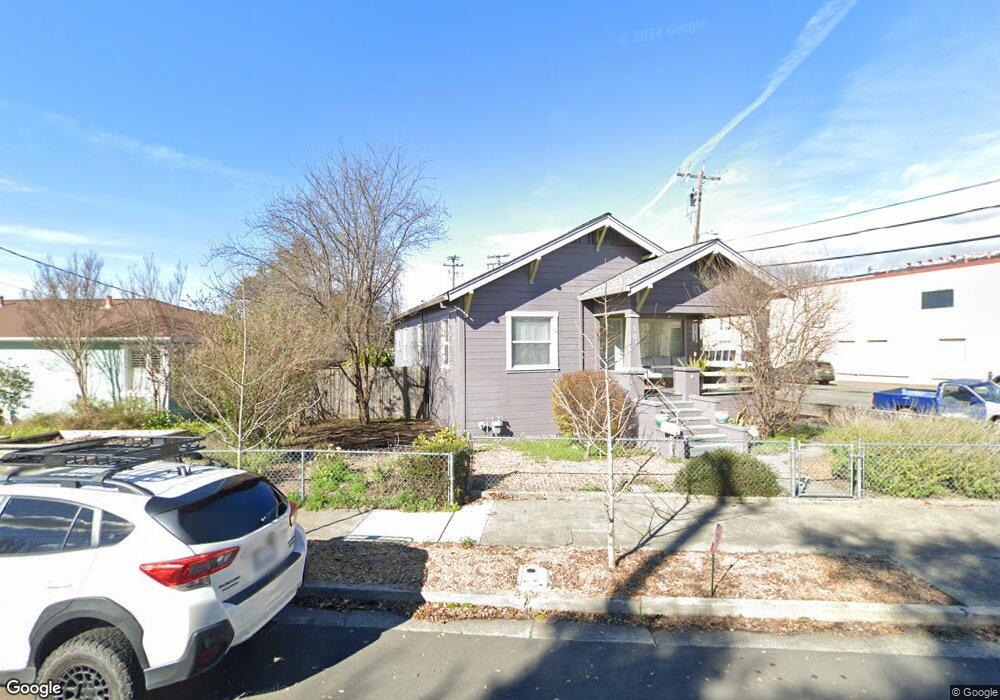
103 Decker St Santa Rosa, CA 95401
Historic Railroad Square NeighborhoodEstimated Value: $538,000 - $639,000
3
Beds
1
Bath
1,234
Sq Ft
$472/Sq Ft
Est. Value
About This Home
This home is located at 103 Decker St, Santa Rosa, CA 95401 and is currently estimated at $582,490, approximately $472 per square foot. 103 Decker St is a home located in Sonoma County with nearby schools including Abraham Lincoln Elementary School, Santa Rosa Middle School, and Santa Rosa High School.
Ownership History
Date
Name
Owned For
Owner Type
Purchase Details
Closed on
Sep 9, 2014
Sold by
Crippen Deborah L
Bought by
Crippen Deborah L and The Deborah L Crippen Trust
Current Estimated Value
Purchase Details
Closed on
Jul 7, 2011
Sold by
Suacci Kelly T
Bought by
Crippen Deborah
Purchase Details
Closed on
Jul 26, 2006
Sold by
Suacci Tyler
Bought by
Suacci Kelly T
Home Financials for this Owner
Home Financials are based on the most recent Mortgage that was taken out on this home.
Original Mortgage
$385,000
Interest Rate
6.62%
Mortgage Type
New Conventional
Purchase Details
Closed on
Apr 13, 2004
Sold by
Ogden Dwaine L
Bought by
Pierce Lloyd E and Pierce Dorothy I
Create a Home Valuation Report for This Property
The Home Valuation Report is an in-depth analysis detailing your home's value as well as a comparison with similar homes in the area
Home Values in the Area
Average Home Value in this Area
Purchase History
| Date | Buyer | Sale Price | Title Company |
|---|---|---|---|
| Crippen Deborah L | -- | None Available | |
| Crippen Deborah | $198,000 | North American Title | |
| Suacci Kelly T | -- | Financial Title Company | |
| Suacci Kelly T | $550,000 | Financial Title Company | |
| Pierce Dorothy I | -- | Financial Title Company | |
| Pierce Lloyd E | $25,000 | Financial Title Company |
Source: Public Records
Mortgage History
| Date | Status | Borrower | Loan Amount |
|---|---|---|---|
| Previous Owner | Suacci Kelly T | $385,000 |
Source: Public Records
Tax History
| Year | Tax Paid | Tax Assessment Tax Assessment Total Assessment is a certain percentage of the fair market value that is determined by local assessors to be the total taxable value of land and additions on the property. | Land | Improvement |
|---|---|---|---|---|
| 2025 | $2,868 | $248,684 | $119,318 | $129,366 |
| 2024 | $2,868 | $243,809 | $116,979 | $126,830 |
| 2023 | $2,868 | $239,030 | $114,686 | $124,344 |
| 2022 | $2,650 | $234,344 | $112,438 | $121,906 |
| 2021 | $2,613 | $229,750 | $110,234 | $119,516 |
| 2020 | $2,607 | $227,395 | $109,104 | $118,291 |
| 2019 | $2,593 | $222,937 | $106,965 | $115,972 |
| 2018 | $2,577 | $218,567 | $104,868 | $113,699 |
| 2017 | $2,531 | $214,282 | $102,812 | $111,470 |
| 2016 | $2,506 | $210,082 | $100,797 | $109,285 |
| 2015 | $2,431 | $206,927 | $99,283 | $107,644 |
| 2014 | $2,284 | $202,875 | $97,339 | $105,536 |
Source: Public Records
Map
Nearby Homes
- 303 Boyce St
- 1035 Maxwell Dr
- 930 Morgan St Unit 3
- 158 N Dutton Ave Unit 4
- 595 N Dutton Ave
- 1127 Cleveland Ave
- 220 Carrillo St
- 432 8th St
- 547 B St
- 312 Benton St
- 100 Ridgway Ave
- 786 Simpson Place
- 107 Sebastopol Ave
- 418 Humboldt St
- 705 College Ave
- 810 7th St Unit 24
- 900 Cherry St
- 1555 W 3rd St
- 48 Yarrow Way
- 588 Roseland Ave
Your Personal Tour Guide
Ask me questions while you tour the home.