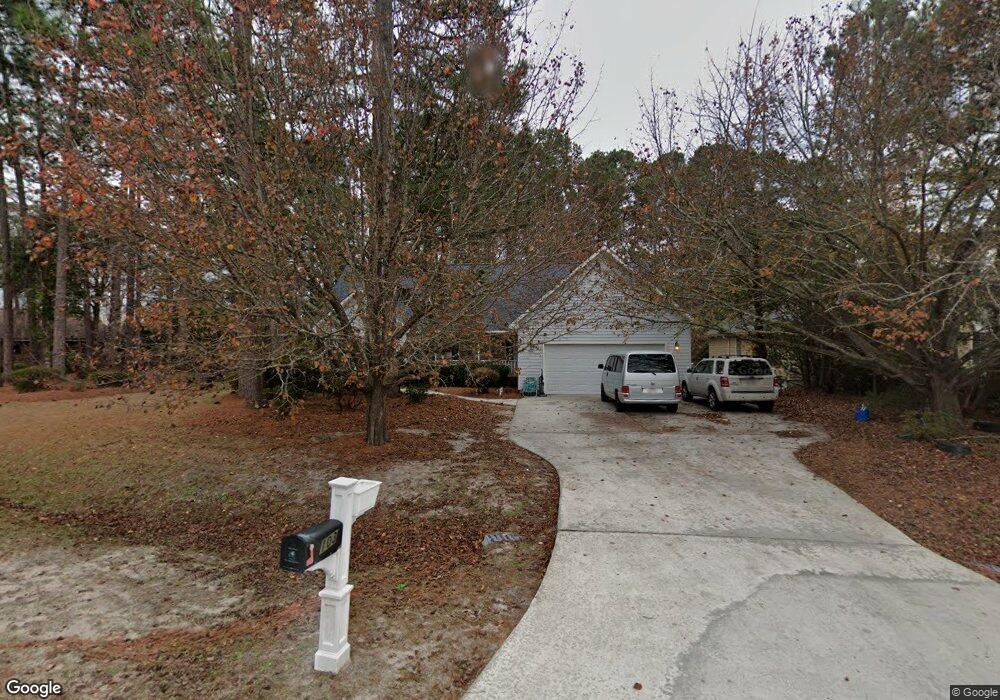
103 Divot Ct Hampstead, NC 28443
Estimated Value: $370,000 - $506,000
3
Beds
2
Baths
1,665
Sq Ft
$246/Sq Ft
Est. Value
About This Home
This home is located at 103 Divot Ct, Hampstead, NC 28443 and is currently estimated at $410,169, approximately $246 per square foot. 103 Divot Ct is a home located in Pender County with nearby schools including Topsail Elementary School, Topsail Middle School, and Topsail High School.
Ownership History
Date
Name
Owned For
Owner Type
Purchase Details
Closed on
Aug 23, 2017
Sold by
Larue Olevia A and Lear Olevia A
Bought by
Pope Glenn T and Ibarcena Pope Marisela
Current Estimated Value
Home Financials for this Owner
Home Financials are based on the most recent Mortgage that was taken out on this home.
Original Mortgage
$221,000
Outstanding Balance
$182,992
Interest Rate
4.03%
Mortgage Type
New Conventional
Estimated Equity
$227,177
Purchase Details
Closed on
Jan 22, 2008
Sold by
Zino John F and Zino Kimberly F
Bought by
Canady John and Canady Major
Home Financials for this Owner
Home Financials are based on the most recent Mortgage that was taken out on this home.
Original Mortgage
$198,432
Interest Rate
6.06%
Mortgage Type
FHA
Purchase Details
Closed on
Aug 21, 2007
Sold by
Zino Investment Properties Inc
Bought by
Zino John F and Zino Kimberly F
Create a Home Valuation Report for This Property
The Home Valuation Report is an in-depth analysis detailing your home's value as well as a comparison with similar homes in the area
Home Values in the Area
Average Home Value in this Area
Purchase History
| Date | Buyer | Sale Price | Title Company |
|---|---|---|---|
| Pope Glenn T | $260,000 | None Available | |
| Canady John | $200,000 | -- | |
| Zino John F | -- | -- |
Source: Public Records
Mortgage History
| Date | Status | Borrower | Loan Amount |
|---|---|---|---|
| Open | Pope Glenn T | $221,000 | |
| Previous Owner | Canady John | $198,432 |
Source: Public Records
Tax History
| Year | Tax Paid | Tax Assessment Tax Assessment Total Assessment is a certain percentage of the fair market value that is determined by local assessors to be the total taxable value of land and additions on the property. | Land | Improvement |
|---|---|---|---|---|
| 2025 | $1,964 | $426,612 | $158,604 | $268,008 |
| 2024 | $1,964 | $190,721 | $45,491 | $145,230 |
| 2023 | $1,964 | $190,721 | $45,491 | $145,230 |
| 2022 | $1,698 | $190,721 | $45,491 | $145,230 |
| 2021 | $1,698 | $190,721 | $45,491 | $145,230 |
| 2020 | $1,698 | $190,721 | $45,491 | $145,230 |
| 2019 | $1,698 | $190,721 | $45,491 | $145,230 |
| 2018 | $1,763 | $189,457 | $60,000 | $129,457 |
| 2017 | $1,763 | $189,457 | $60,000 | $129,457 |
| 2016 | $1,854 | $189,457 | $60,000 | $129,457 |
| 2015 | $1,819 | $189,457 | $60,000 | $129,457 |
| 2014 | $1,441 | $189,457 | $60,000 | $129,457 |
| 2013 | -- | $189,457 | $60,000 | $129,457 |
| 2012 | -- | $189,457 | $60,000 | $129,457 |
Source: Public Records
Map
Nearby Homes
- 400 Azalea Dr
- 104 Par Ct
- 702 Azalea Dr Unit 495
- 100 Southern Magnolia Ct
- 130 Azalea Dr
- 408 N Belvedere Dr
- 108 Bay Tree Cir
- 718 Azalea Dr Unit 460
- 718 Azalea Dr Unit 458
- 103 Holly Tree Ln
- 732 Azalea Dr Unit 406
- 123 Penquin Place
- 0 Penquin Place Unit 26387277
- 100 Yacht Basin Landing
- 128 S Belvedere Dr
- 00 Sloop Pt Rd & 17 Rd
- 333 Tall Ships Ln
- 136 S Belvedere Dr
- 107 Wild Berry Ln
- 568 Sailor Sky Way
- 101 Divot Ct
- 101 Divot Ln
- 23 Divot Ln
- 104 Divot Ln
- 105 Divot Ct
- 102 Eagle Ln
- 100 Eagle Ln
- 104 Eagle Ln
- Lot 182 Long Leaf Dr
- 93 Long Leaf Dr
- Lot 43 Long Leaf Dr
- Lot 100 Long Leaf Dr
- Lot 7 Long Leaf Dr
- 102 Divot Ct
- 211 Long Leaf Dr
- 216 Long Leaf Dr
- 34 Eagle Ln
- 0 Eagle Ln
- Lot 32 Eagle Ln
- 209 Long Leaf Dr
Your Personal Tour Guide
Ask me questions while you tour the home.