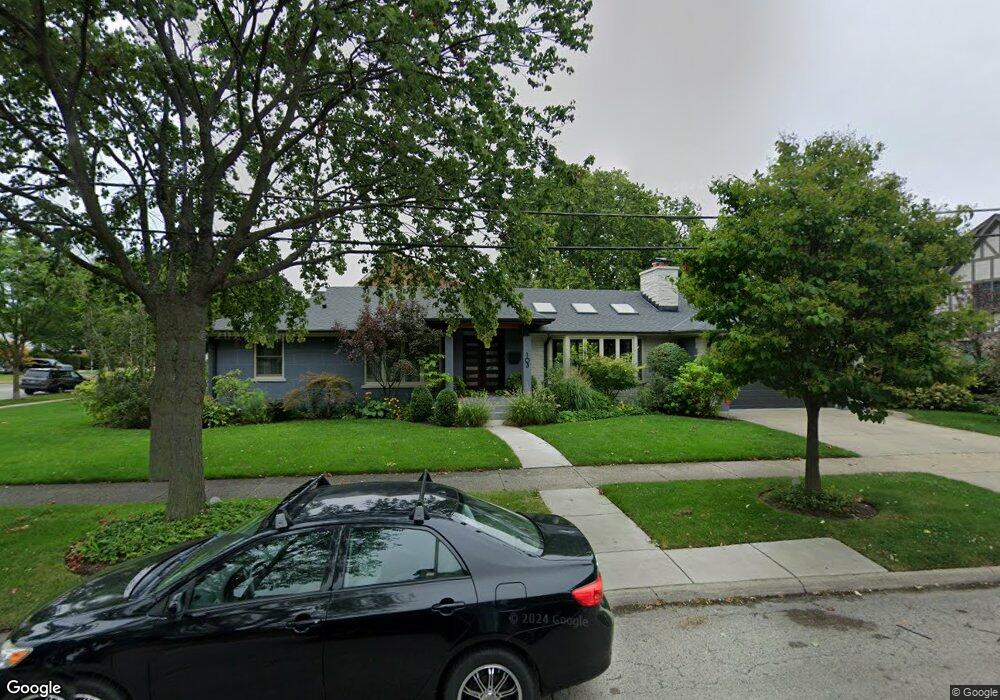
103 E Lahon St Park Ridge, IL 60068
Estimated Value: $416,000 - $867,000
4
Beds
2
Baths
1,564
Sq Ft
$427/Sq Ft
Est. Value
About This Home
This home is located at 103 E Lahon St, Park Ridge, IL 60068 and is currently estimated at $668,453, approximately $427 per square foot. 103 E Lahon St is a home located in Cook County with nearby schools including Eugene Field Elementary School, Emerson Middle School, and Maine South High School.
Ownership History
Date
Name
Owned For
Owner Type
Purchase Details
Closed on
Feb 24, 2025
Sold by
Bente Calin I and Bente Erika
Bought by
Shapiro James A and Clifford Karin E
Current Estimated Value
Home Financials for this Owner
Home Financials are based on the most recent Mortgage that was taken out on this home.
Original Mortgage
$806,500
Outstanding Balance
$802,380
Interest Rate
6.88%
Mortgage Type
New Conventional
Estimated Equity
-$133,927
Purchase Details
Closed on
Sep 14, 2020
Sold by
Sullivan Amy J and The Polona R Filpi Living Trus
Bought by
Bente Calin I
Home Financials for this Owner
Home Financials are based on the most recent Mortgage that was taken out on this home.
Original Mortgage
$393,750
Interest Rate
2.87%
Mortgage Type
New Conventional
Purchase Details
Closed on
Oct 17, 2014
Sold by
Filpi Polona R
Bought by
Filpi Polona R and Polona R Filpi Living Trust
Create a Home Valuation Report for This Property
The Home Valuation Report is an in-depth analysis detailing your home's value as well as a comparison with similar homes in the area
Home Values in the Area
Average Home Value in this Area
Purchase History
| Date | Buyer | Sale Price | Title Company |
|---|---|---|---|
| Shapiro James A | $1,275,000 | None Listed On Document | |
| Bente Calin I | $525,000 | Attorneys Ttl Guaranty Fund | |
| Filpi Polona R | -- | None Available |
Source: Public Records
Mortgage History
| Date | Status | Borrower | Loan Amount |
|---|---|---|---|
| Open | Shapiro James A | $806,500 | |
| Previous Owner | Bente Calin I | $393,750 |
Source: Public Records
Tax History Compared to Growth
Tax History
| Year | Tax Paid | Tax Assessment Tax Assessment Total Assessment is a certain percentage of the fair market value that is determined by local assessors to be the total taxable value of land and additions on the property. | Land | Improvement |
|---|---|---|---|---|
| 2024 | $3,099 | $11,421 | $4,250 | $7,171 |
| 2023 | $2,970 | $11,421 | $4,250 | $7,171 |
| 2022 | $2,970 | $11,421 | $4,250 | $7,171 |
| 2021 | $2,573 | $8,461 | $2,970 | $5,491 |
| 2020 | $2,145 | $8,461 | $2,970 | $5,491 |
| 2019 | $2,068 | $9,169 | $2,970 | $6,199 |
| 2018 | $2,652 | $10,503 | $2,557 | $7,946 |
| 2017 | $2,993 | $10,503 | $2,557 | $7,946 |
| 2016 | $2,882 | $10,503 | $2,557 | $7,946 |
| 2015 | $2,576 | $8,351 | $2,145 | $6,206 |
| 2014 | $2,525 | $8,351 | $2,145 | $6,206 |
| 2013 | $2,704 | $9,443 | $2,145 | $7,298 |
Source: Public Records
Map
Nearby Homes
- 130 E Lahon St
- 108 E Edgemont Ln
- 820 N Merrill St
- 611 East Ave
- 240 E Sibley St
- 7524 W Jonquil Terrace
- 228 E Kathleen Dr
- 7630 N Oleander Ave
- 7525 N Overhill Ave Unit 206
- 7815 N Oleander Ave
- 8041 N Merrill St
- 8032 N Wisner St
- 7441 N Oriole Ave
- 8114 N Ottawa Ave
- 8130 N Ottawa Ave
- 7422 N Olcott Ave
- 900 N Prospect Ave
- 8209 N Oleander Ave
- 8144 N Osceola Ave
- 7255 N Oriole Ave