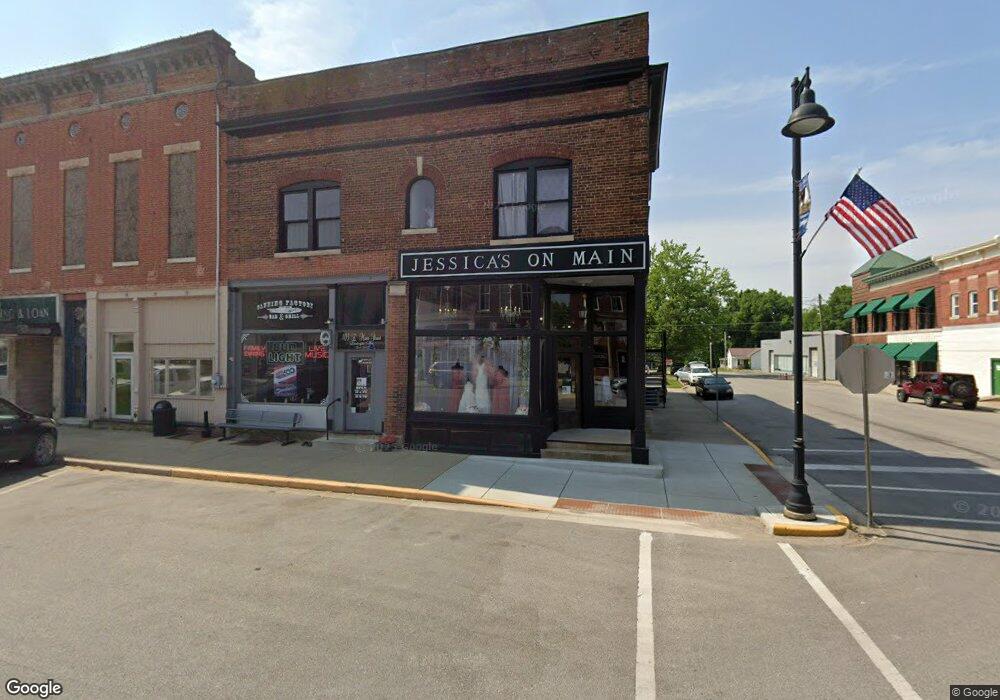
103 E Main St Ladoga, IN 47954
Estimated Value: $150,660
Studio
--
Bath
1,260
Sq Ft
$120/Sq Ft
Est. Value
About This Home
This home is located at 103 E Main St, Ladoga, IN 47954 and is currently priced at $150,660, approximately $119 per square foot. 103 E Main St is a home located in Montgomery County with nearby schools including Southmont Senior High School and Ladoga Academy.
Ownership History
Date
Name
Owned For
Owner Type
Purchase Details
Closed on
Apr 10, 2024
Sold by
Jones Jerry J and Jones Leigh
Bought by
Hubble Ronda and Cloncs Briana
Current Estimated Value
Home Financials for this Owner
Home Financials are based on the most recent Mortgage that was taken out on this home.
Original Mortgage
$200,000
Outstanding Balance
$195,972
Interest Rate
6.74%
Mortgage Type
New Conventional
Purchase Details
Closed on
Sep 15, 2023
Sold by
Cating Investments Llc
Bought by
Jones Jerry J and Jones Leigh
Home Financials for this Owner
Home Financials are based on the most recent Mortgage that was taken out on this home.
Original Mortgage
$120,000
Interest Rate
7.88%
Mortgage Type
New Conventional
Purchase Details
Closed on
Apr 3, 2018
Sold by
Cating Brett A and Cating Amy J
Bought by
Cating Investments Llc
Purchase Details
Closed on
Mar 24, 2017
Sold by
Brewer Marvin
Bought by
Cating Brett
Purchase Details
Closed on
Dec 10, 2007
Sold by
Ladoga Masonic Building Co
Bought by
Brewer Marvin and Brewer Dorothy
Create a Home Valuation Report for This Property
The Home Valuation Report is an in-depth analysis detailing your home's value as well as a comparison with similar homes in the area
Purchase History
| Date | Buyer | Sale Price | Title Company |
|---|---|---|---|
| Hubble Ronda | $75,000 | None Listed On Document | |
| Jones Jerry J | $75,000 | None Listed On Document | |
| Cating Investments Llc | -- | None Available | |
| Cating Brett | -- | None Available | |
| Brewer Marvin | $5,000 | None Available |
Source: Public Records
Mortgage History
| Date | Status | Borrower | Loan Amount |
|---|---|---|---|
| Open | Hubble Ronda | $200,000 | |
| Previous Owner | Jones Jerry J | $120,000 |
Source: Public Records
Tax History
| Year | Tax Paid | Tax Assessment Tax Assessment Total Assessment is a certain percentage of the fair market value that is determined by local assessors to be the total taxable value of land and additions on the property. | Land | Improvement |
|---|---|---|---|---|
| 2025 | $429 | $20,500 | $2,400 | $18,100 |
| 2024 | $429 | $17,700 | $2,400 | $15,300 |
| 2023 | $410 | $17,900 | $2,400 | $15,500 |
| 2022 | $410 | $17,600 | $2,400 | $15,200 |
| 2021 | $409 | $16,700 | $2,400 | $14,300 |
| 2020 | $397 | $16,700 | $2,400 | $14,300 |
| 2019 | $393 | $16,900 | $2,400 | $14,500 |
| 2018 | $380 | $16,900 | $2,400 | $14,500 |
| 2017 | $396 | $16,500 | $2,400 | $14,100 |
| 2016 | $394 | $16,500 | $2,400 | $14,100 |
| 2014 | $383 | $16,300 | $2,400 | $13,900 |
| 2013 | $383 | $26,000 | $2,400 | $23,600 |
Source: Public Records
Map
Nearby Homes
- 700 South St
- 417 N West St
- 00 Academy Way
- 420 N Franklin St
- 8568 S Academy Way
- 5000 E State Road 234
- 772 Northern Acres Dr
- 780 Northern Acres Dr
- 781 Northern Acres Dr
- 4536 E 1000 S
- 8526 Sandrea Ln S
- 13455 N Co Road 425 E
- 10 W Washington St
- 104 E Washington St
- 102 N Meridian St
- 100 East St
- 11 N Indiana St
- 5193 E State Road 236
- 6647 S 1050 E
- 9613 E New Ross Rd
Your Personal Tour Guide
Ask me questions while you tour the home.