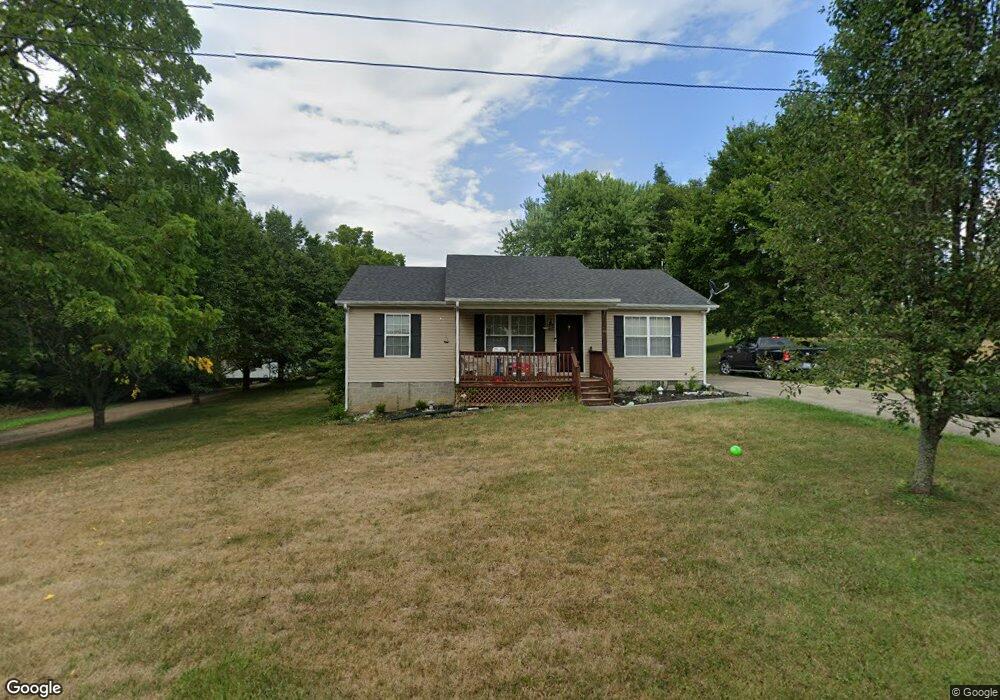
103 East Rd Stanford, KY 40484
Estimated Value: $183,390 - $213,000
3
Beds
2
Baths
1,272
Sq Ft
$154/Sq Ft
Est. Value
About This Home
This home is located at 103 East Rd, Stanford, KY 40484 and is currently estimated at $195,348, approximately $153 per square foot. 103 East Rd is a home located in Lincoln County with nearby schools including Lincoln County High School.
Ownership History
Date
Name
Owned For
Owner Type
Purchase Details
Closed on
Feb 8, 2021
Sold by
Day Matthew
Bought by
Johnson Paul and Johnson Victoria
Current Estimated Value
Home Financials for this Owner
Home Financials are based on the most recent Mortgage that was taken out on this home.
Original Mortgage
$126,262
Outstanding Balance
$112,470
Interest Rate
2.6%
Mortgage Type
New Conventional
Estimated Equity
$82,878
Purchase Details
Closed on
May 23, 2018
Sold by
Mills William Z and Mills Erica N
Bought by
Day Matthew and Day Olivia
Home Financials for this Owner
Home Financials are based on the most recent Mortgage that was taken out on this home.
Original Mortgage
$99,114
Interest Rate
4.5%
Mortgage Type
Commercial
Purchase Details
Closed on
Sep 9, 2009
Sold by
Sowder Roger and Sowder Robonnia
Bought by
Mills William Z and Mcguffey Erica N
Home Financials for this Owner
Home Financials are based on the most recent Mortgage that was taken out on this home.
Original Mortgage
$89,760
Interest Rate
5.19%
Mortgage Type
New Conventional
Create a Home Valuation Report for This Property
The Home Valuation Report is an in-depth analysis detailing your home's value as well as a comparison with similar homes in the area
Home Values in the Area
Average Home Value in this Area
Purchase History
| Date | Buyer | Sale Price | Title Company |
|---|---|---|---|
| Johnson Paul | $125,000 | None Available | |
| Day Matthew | $95,000 | None Available | |
| Mills William Z | $88,000 | None Available |
Source: Public Records
Mortgage History
| Date | Status | Borrower | Loan Amount |
|---|---|---|---|
| Open | Johnson Paul | $126,262 | |
| Previous Owner | Day Matthew | $99,114 | |
| Previous Owner | Mills William Z | $89,760 |
Source: Public Records
Tax History Compared to Growth
Tax History
| Year | Tax Paid | Tax Assessment Tax Assessment Total Assessment is a certain percentage of the fair market value that is determined by local assessors to be the total taxable value of land and additions on the property. | Land | Improvement |
|---|---|---|---|---|
| 2025 | $1,283 | $125,000 | $15,000 | $110,000 |
| 2024 | $1,283 | $125,000 | $16,000 | $109,000 |
| 2023 | $1,296 | $125,000 | $16,000 | $109,000 |
| 2022 | $1,299 | $125,000 | $16,000 | $109,000 |
| 2021 | $1,010 | $95,000 | $0 | $0 |
| 2020 | $1,033 | $95,000 | $0 | $0 |
| 2019 | $1,043 | $95,000 | $0 | $0 |
| 2018 | $957 | $88,000 | $0 | $0 |
| 2017 | -- | $88,000 | $0 | $0 |
| 2016 | $940 | $88,000 | $0 | $0 |
| 2015 | $785 | $88,000 | $0 | $0 |
| 2012 | $785 | $88,000 | $9,000 | $79,000 |
Source: Public Records
Map
Nearby Homes
- 137 Rice Ln
- Tract A Goshen Rd
- 2670 Us Highway 150
- 828 E Main St
- 642 Preachersville Rd
- 3330 Kentucky 1770
- 228 Powell St
- 212 S Loop Dr
- 230 S Loop Dr
- 25 A&B Jessica Way
- 43 A&B Jessica Way
- 115 Shady Brook Dr
- 108 Logan Ave
- 0 Logan Creek Dr
- 104 Clover Ct
- 1570 Kentucky 1247
- 90 Wrsl Rd
- 127 Eastwood Dr
- 301 Redwood Dr
- 000 Foster Ln