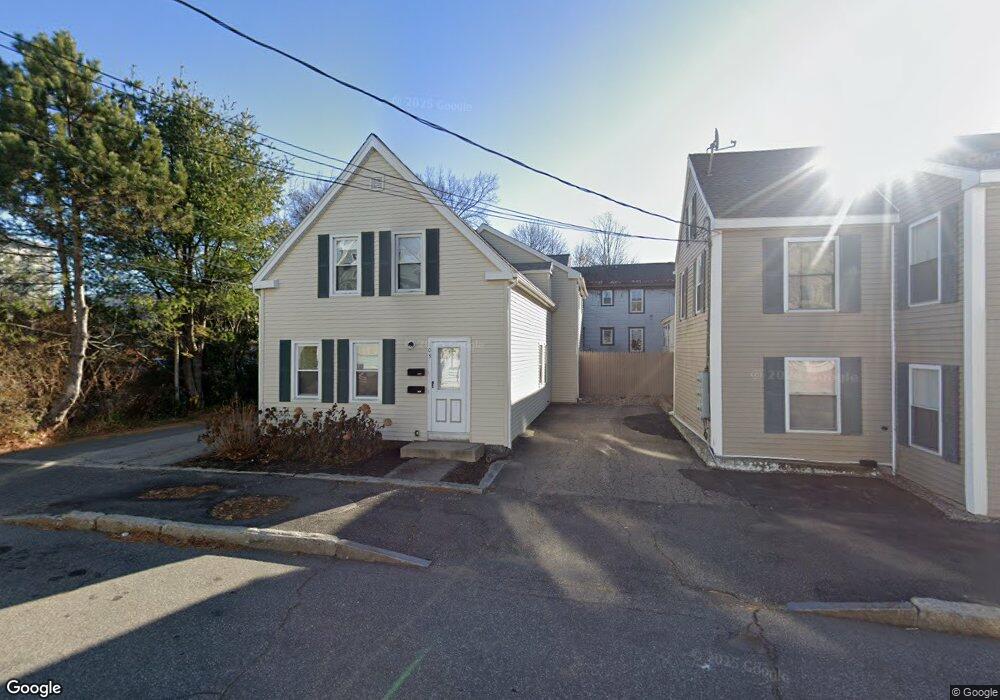
103 Foss St Biddeford, ME 04005
Downtown Biddeford NeighborhoodEstimated Value: $438,000 - $605,000
4
Beds
2
Baths
2,474
Sq Ft
$206/Sq Ft
Est. Value
About This Home
Beautiful second floor living in walking distance to downtown Biddeford!
Unit includes 2 bedrooms (both large enough for king sized beds), 1 bathroom with in unit laundry. Large kitchen with dishwasher. Bonus nook for a workspace! Rent does not include heat and electric.
Ownership History
Date
Name
Owned For
Owner Type
Purchase Details
Closed on
Mar 4, 2020
Sold by
Cma Properties Llc
Bought by
Russell Katelynn B
Current Estimated Value
Home Financials for this Owner
Home Financials are based on the most recent Mortgage that was taken out on this home.
Original Mortgage
$277,875
Outstanding Balance
$246,563
Interest Rate
3.6%
Mortgage Type
New Conventional
Estimated Equity
$262,829
Purchase Details
Closed on
Oct 2, 2018
Sold by
Clark Richard M and Clark Jessica A
Bought by
Cma Properties Llc
Home Financials for this Owner
Home Financials are based on the most recent Mortgage that was taken out on this home.
Original Mortgage
$150,000
Interest Rate
4.5%
Mortgage Type
New Conventional
Create a Home Valuation Report for This Property
The Home Valuation Report is an in-depth analysis detailing your home's value as well as a comparison with similar homes in the area
Home Values in the Area
Average Home Value in this Area
Purchase History
| Date | Buyer | Sale Price | Title Company |
|---|---|---|---|
| Russell Katelynn B | -- | None Available | |
| Cma Properties Llc | -- | -- |
Source: Public Records
Mortgage History
| Date | Status | Borrower | Loan Amount |
|---|---|---|---|
| Open | Russell Katelynn B | $277,875 | |
| Previous Owner | Cma Properties Llc | $150,000 |
Source: Public Records
Property History
| Date | Event | Price | List to Sale | Price per Sq Ft |
|---|---|---|---|---|
| 01/27/2025 01/27/25 | Off Market | -- | -- | -- |
| 01/05/2025 01/05/25 | For Rent | -- | -- | -- |
Tax History Compared to Growth
Tax History
| Year | Tax Paid | Tax Assessment Tax Assessment Total Assessment is a certain percentage of the fair market value that is determined by local assessors to be the total taxable value of land and additions on the property. | Land | Improvement |
|---|---|---|---|---|
| 2024 | $4,786 | $336,600 | $119,300 | $217,300 |
| 2023 | $4,373 | $333,300 | $119,300 | $214,000 |
| 2022 | $3,597 | $219,200 | $58,600 | $160,600 |
| 2021 | $3,407 | $186,900 | $47,900 | $139,000 |
| 2020 | $3,100 | $154,600 | $37,300 | $117,300 |
| 2019 | $2,753 | $137,800 | $37,300 | $100,500 |
| 2018 | $2,715 | $137,800 | $37,300 | $100,500 |
| 2017 | $2,679 | $133,500 | $37,300 | $96,200 |
| 2016 | $2,651 | $133,500 | $37,300 | $96,200 |
| 2015 | $2,599 | $133,500 | $37,300 | $96,200 |
| 2014 | $2,535 | $133,500 | $37,300 | $96,200 |
| 2013 | -- | $197,700 | $61,200 | $136,500 |
Source: Public Records
Map
Nearby Homes
- 109 Alfred Rd
- 93 Summer St
- 99 Summer St
- 11 King St
- 155 Hill St
- 17 Granite St
- 84 Pike St
- 38 South St
- 16 Hill St
- 40 South St
- 66 Graham St
- 2 Main St Unit 17-506
- 2 Main St Unit 15-310
- 2 Main St Unit 15-403
- 2 Main St Unit 18-420
- 2 Main St Unit 15-311
- 2 Main St Unit 17-508
- 2 Main St Unit 17-414
- 2 Main St Unit 18-307
- 2 Main St Unit 17-415