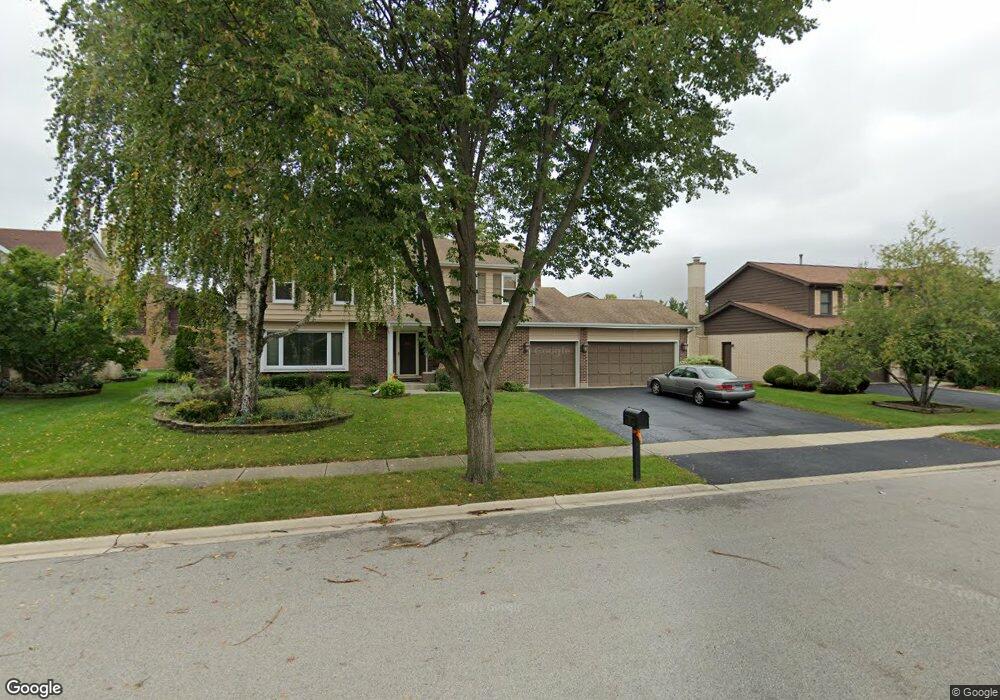
103 Golf View Cir Prospect Heights, IL 60070
Estimated Value: $669,000 - $692,000
4
Beds
3
Baths
2,416
Sq Ft
$283/Sq Ft
Est. Value
About This Home
This home is located at 103 Golf View Cir, Prospect Heights, IL 60070 and is currently estimated at $682,688, approximately $282 per square foot. 103 Golf View Cir is a home located in Cook County with nearby schools including Euclid Elementary School, River Trails Middle School, and John Hersey High School.
Ownership History
Date
Name
Owned For
Owner Type
Purchase Details
Closed on
Apr 17, 2006
Sold by
Horlamus John and Horlamus Kimberly
Bought by
Horlamus John and Horlamus Kimberly
Current Estimated Value
Purchase Details
Closed on
Jul 6, 2004
Sold by
Fleury Craig E
Bought by
Horlamius John P and Nelson Kimberly J
Home Financials for this Owner
Home Financials are based on the most recent Mortgage that was taken out on this home.
Original Mortgage
$388,000
Outstanding Balance
$192,204
Interest Rate
6.42%
Mortgage Type
New Conventional
Estimated Equity
$490,484
Purchase Details
Closed on
Oct 9, 1998
Sold by
Moor Richard and Moor Magdalena
Bought by
Fleury Craig E
Home Financials for this Owner
Home Financials are based on the most recent Mortgage that was taken out on this home.
Original Mortgage
$301,500
Interest Rate
5.62%
Create a Home Valuation Report for This Property
The Home Valuation Report is an in-depth analysis detailing your home's value as well as a comparison with similar homes in the area
Home Values in the Area
Average Home Value in this Area
Purchase History
| Date | Buyer | Sale Price | Title Company |
|---|---|---|---|
| Horlamus John | -- | First American Title Ins Co | |
| Horlamius John P | $490,000 | Cti | |
| Fleury Craig E | $335,000 | -- |
Source: Public Records
Mortgage History
| Date | Status | Borrower | Loan Amount |
|---|---|---|---|
| Open | Horlamius John P | $388,000 | |
| Previous Owner | Fleury Craig E | $301,500 |
Source: Public Records
Tax History
| Year | Tax Paid | Tax Assessment Tax Assessment Total Assessment is a certain percentage of the fair market value that is determined by local assessors to be the total taxable value of land and additions on the property. | Land | Improvement |
|---|---|---|---|---|
| 2025 | $14,898 | $60,064 | $7,774 | $52,290 |
| 2024 | $14,898 | $50,000 | $7,774 | $42,226 |
| 2023 | $13,948 | $50,000 | $7,774 | $42,226 |
| 2022 | $13,948 | $50,000 | $7,774 | $42,226 |
| 2021 | $11,636 | $37,040 | $4,859 | $32,181 |
| 2020 | $13,185 | $42,870 | $4,859 | $38,011 |
| 2019 | $13,226 | $47,900 | $4,859 | $43,041 |
| 2018 | $14,211 | $46,711 | $4,130 | $42,581 |
| 2017 | $14,037 | $46,711 | $4,130 | $42,581 |
| 2016 | $13,362 | $46,711 | $4,130 | $42,581 |
| 2015 | $13,215 | $42,849 | $3,644 | $39,205 |
| 2014 | $13,086 | $42,849 | $3,644 | $39,205 |
| 2013 | $12,755 | $42,849 | $3,644 | $39,205 |
Source: Public Records
Map
Nearby Homes
- 7 Alton Rd
- 1414 N Indigo Dr
- 103 Coldren Dr
- 513 Green Bridge Ln Unit B
- 509 Aberdeen Ln Unit C
- 501 Aberdeen Ln Unit C
- 109 Rob Roy Ln Unit C
- 1107 N Greenfield Ln
- 304 E Camp Mcdonald Rd
- 1811 Azalea Ln
- 15 E Willow Rd
- 1176 N Boxwood Dr Unit A
- 206 E Camp Mcdonald Rd
- 601 E Hackberry Ln
- 1975 Merlot Ct
- 55 Willow Rd
- 1019 N Boxwood Dr Unit 1019107
- 1825 E Euclid Ave
- 1203 N Burning Bush Ln
- 1821 E Boulder Dr
- 101 Golf View Cir
- 107 Golf View Cir
- 139 Golf View Cir
- 111 Golf View Cir
- 137 Golf View Cir
- 106 Golf View Cir
- 125 Golf View Cir
- 108 Golf View Cir
- 129 Golf View Cir
- 117 Golf View Cir
- 104 Golf View Cir
- 110 Golf View Cir
- 138 Golf View Cir
- 112 Golf View Cir
- 136 Golf View Cir
- 114 Golf View Cir
- 134 Golf View Cir
- 116 Golf View Cir
- 124 Golf View Cir
- 132 Golf View Cir
Your Personal Tour Guide
Ask me questions while you tour the home.