R
Landlord's Agent in 2025
Ravi Bheemarao
RB Real Estate Agency
(713) 376-7483
5 in this area
197 Total Sales
Estimated Value: $520,000 - $579,189
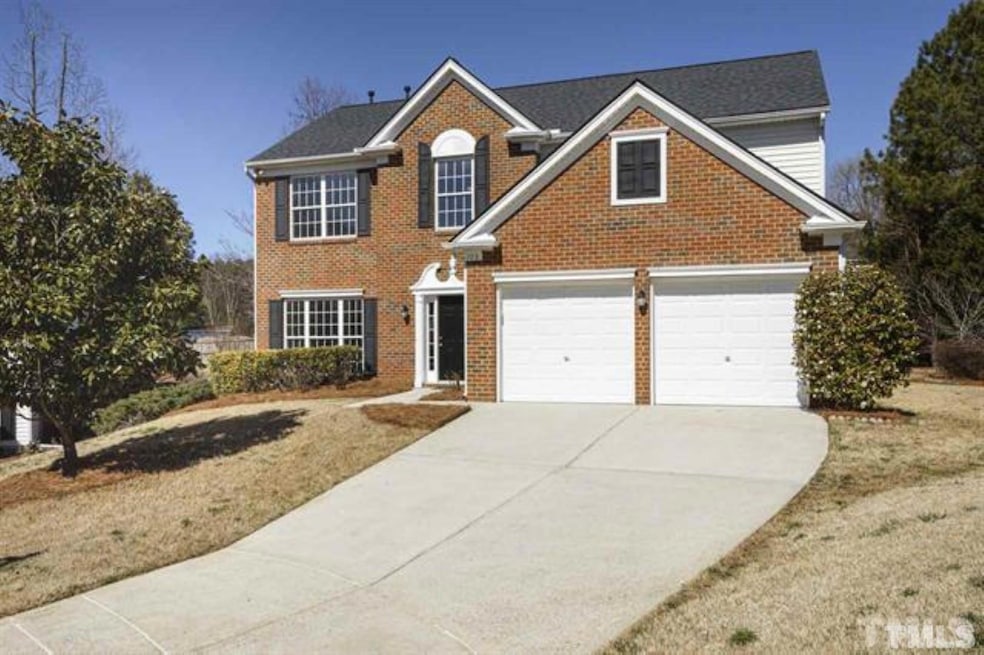
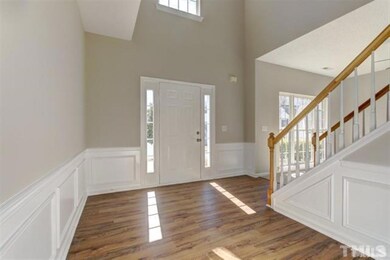
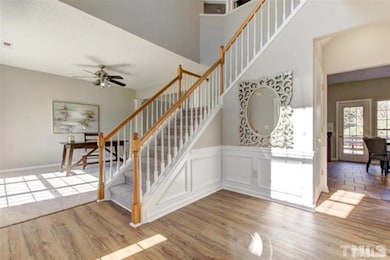
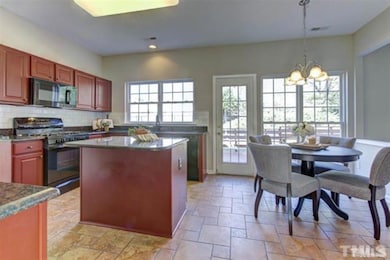
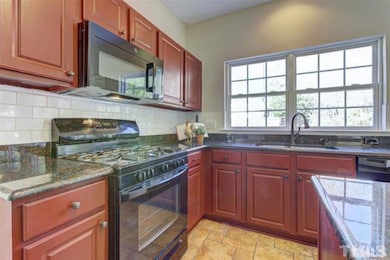
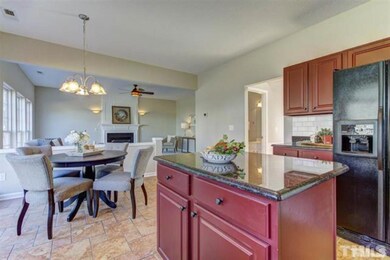
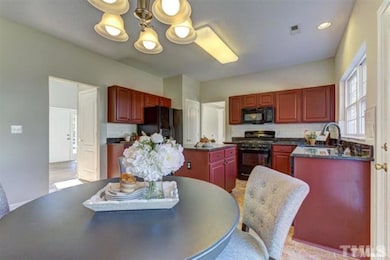
Welcome Home!! Fantastic private Cul-De Sac open floor plan home. 4 bedroom and a huge relaxing backyard. Granite counter tops, stainless steel appliances and an island in the kitchen overlooking family room. Huge master bed room in 2nd floor with walk-in closet. Large secondary bed rooms. Close to shopping and major highways. Resort like amenities with pool. Excellent schools!!. A MUST SEE!!
Last Agent to Rent the Property
RB Real Estate Agency License #225340 Listed on: 09/07/2025
| Date | Buyer | Sale Price | Title Company |
|---|---|---|---|
| Nukala Ravi | $405,000 | None Available | |
| Arunachalam Saravanan | $167,500 | -- |
| Date | Status | Borrower | Loan Amount |
|---|---|---|---|
| Open | Nukala Ravi | $202,500 | |
| Previous Owner | Arunachalam Saravanan | $133,632 | |
| Closed | Arunachalam Saravanan | $15,949 |
| Date | Event | Price | List to Sale | Price per Sq Ft |
|---|---|---|---|---|
| 10/06/2025 10/06/25 | Rented | $2,495 | 0.0% | -- |
| 09/16/2025 09/16/25 | Under Contract | -- | -- | -- |
| 09/07/2025 09/07/25 | For Rent | $2,495 | -- | -- |
| Year | Tax Paid | Tax Assessment Tax Assessment Total Assessment is a certain percentage of the fair market value that is determined by local assessors to be the total taxable value of land and additions on the property. | Land | Improvement |
|---|---|---|---|---|
| 2025 | $4,350 | $495,927 | $180,000 | $315,927 |
| 2024 | $4,253 | $495,927 | $180,000 | $315,927 |
| 2023 | $3,704 | $335,817 | $80,000 | $255,817 |
| 2022 | $3,477 | $335,817 | $80,000 | $255,817 |
| 2021 | $3,345 | $335,817 | $80,000 | $255,817 |
| 2020 | $1,661 | $335,817 | $80,000 | $255,817 |
| 2019 | $2,935 | $256,692 | $75,000 | $181,692 |
| 2018 | $0 | $256,692 | $75,000 | $181,692 |
| 2017 | $2,574 | $256,692 | $75,000 | $181,692 |
| 2016 | $2,537 | $256,692 | $75,000 | $181,692 |
| 2015 | $2,364 | $233,362 | $50,000 | $183,362 |
| 2014 | $2,279 | $233,362 | $50,000 | $183,362 |
R
Landlord's Agent in 2025
Ravi Bheemarao
RB Real Estate Agency
(713) 376-7483
5 in this area
197 Total Sales
Source: Doorify MLS
MLS Number: 10120434
APN: 0721.02-69-6052-000
Disclaimer: Certain information contained herein is derived from information provided by parties other than Homes.com. All information provided is deemed reliable, but is not guaranteed to be accurate and should be independently verified.
![]() Some IDX listings have been excluded from this IDX display. Brokers make an effort to deliver accurate information, but buyers should independently verify any information on which they will rely in a transaction. The listing broker shall not be responsible for any typographical errors, misinformation, or misprints, and they shall be held totally harmless from any damages arising from reliance upon this data. This data is provided exclusively for consumers’ personal, non-commercial use. Listings marked with an icon are provided courtesy of the Doorify MLS, Inc. of North Carolina, Internet Data Exchange Database. Closed (sold) listings may have been listed and/or sold by a real estate firm other than the firm(s) featured on this website. Closed data is not available until the sale of the property is recorded in the MLS. Home sale data is not an appraisal, CMA, competitive or comparative market analysis, or home valuation of any property. Copyright 2025 Doorify MLS, Inc. of North Carolina. All rights reserved.
Some IDX listings have been excluded from this IDX display. Brokers make an effort to deliver accurate information, but buyers should independently verify any information on which they will rely in a transaction. The listing broker shall not be responsible for any typographical errors, misinformation, or misprints, and they shall be held totally harmless from any damages arising from reliance upon this data. This data is provided exclusively for consumers’ personal, non-commercial use. Listings marked with an icon are provided courtesy of the Doorify MLS, Inc. of North Carolina, Internet Data Exchange Database. Closed (sold) listings may have been listed and/or sold by a real estate firm other than the firm(s) featured on this website. Closed data is not available until the sale of the property is recorded in the MLS. Home sale data is not an appraisal, CMA, competitive or comparative market analysis, or home valuation of any property. Copyright 2025 Doorify MLS, Inc. of North Carolina. All rights reserved.
