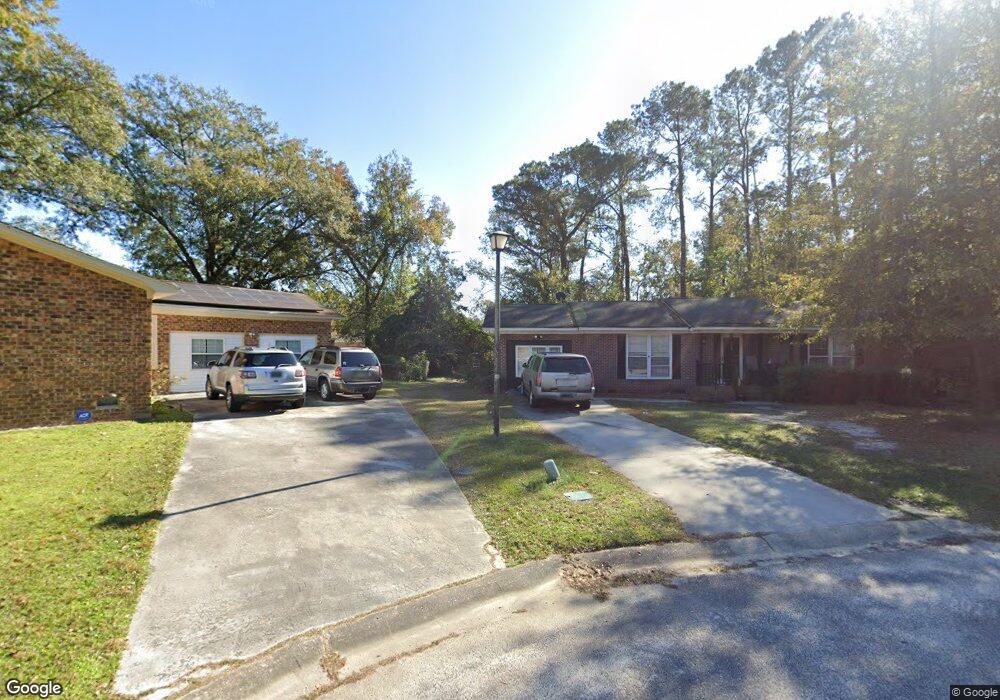
103 Helen Ct Ladson, SC 29456
Estimated Value: $204,000 - $276,000
3
Beds
2
Baths
1,176
Sq Ft
$201/Sq Ft
Est. Value
About This Home
This home is located at 103 Helen Ct, Ladson, SC 29456 and is currently estimated at $236,290, approximately $200 per square foot. 103 Helen Ct is a home located in Dorchester County with nearby schools including Dr. Eugene Sires Elementary, Oakbrook Middle School, and Ashley Ridge High School.
Ownership History
Date
Name
Owned For
Owner Type
Purchase Details
Closed on
May 15, 2025
Sold by
Limehouse Thomas A
Bought by
Gethers Rodney and Jamison Keisha Latonya
Current Estimated Value
Purchase Details
Closed on
Mar 25, 2025
Sold by
Waiters Thomas
Bought by
Limehouse Thomas A
Purchase Details
Closed on
Feb 14, 2025
Sold by
Gethers Rodney
Bought by
Limehouse Thomas
Purchase Details
Closed on
Feb 4, 2025
Sold by
Delinquent Tax Collector For Dorchester
Bought by
Limehouse Thomas
Purchase Details
Closed on
Aug 6, 2016
Sold by
Waiters Thomas
Bought by
Waiters Thomas and Gethers Rodney
Purchase Details
Closed on
Jul 3, 2015
Sold by
Gethers Rodney
Bought by
Waiters Thomas
Purchase Details
Closed on
Aug 4, 2014
Sold by
Estate Of Thaddeus Waiters Sr and Waiters Thomas
Bought by
Gethers Rodney
Create a Home Valuation Report for This Property
The Home Valuation Report is an in-depth analysis detailing your home's value as well as a comparison with similar homes in the area
Home Values in the Area
Average Home Value in this Area
Purchase History
| Date | Buyer | Sale Price | Title Company |
|---|---|---|---|
| Gethers Rodney | $209,000 | None Listed On Document | |
| Gethers Rodney | $209,000 | None Listed On Document | |
| Limehouse Thomas A | -- | None Listed On Document | |
| Limehouse Thomas A | -- | None Listed On Document | |
| Limehouse Thomas | -- | None Listed On Document | |
| Limehouse Thomas | $80,000 | None Listed On Document | |
| Limehouse Thomas | $80,000 | None Listed On Document | |
| Waiters Thomas | -- | None Available | |
| Waiters Thomas | -- | -- | |
| Gethers Rodney | -- | -- |
Source: Public Records
Tax History Compared to Growth
Tax History
| Year | Tax Paid | Tax Assessment Tax Assessment Total Assessment is a certain percentage of the fair market value that is determined by local assessors to be the total taxable value of land and additions on the property. | Land | Improvement |
|---|---|---|---|---|
| 2024 | $2,582 | $16,886 | $5,100 | $11,786 |
| 2023 | $2,582 | $7,847 | $1,920 | $5,927 |
| 2022 | $2,310 | $6,000 | $1,930 | $4,070 |
| 2021 | $2,310 | $6,000 | $1,930 | $4,070 |
| 2020 | $2,218 | $5,220 | $1,680 | $3,540 |
| 2019 | $2,185 | $5,220 | $1,680 | $3,540 |
| 2018 | $1,863 | $5,220 | $1,680 | $3,540 |
| 2017 | $1,857 | $5,220 | $1,680 | $3,540 |
| 2016 | $1,828 | $5,220 | $1,680 | $3,540 |
| 2015 | $1,825 | $5,220 | $1,680 | $3,540 |
| 2014 | $1,928 | $93,840 | $0 | $0 |
| 2013 | -- | $3,750 | $0 | $0 |
Source: Public Records
Map
Nearby Homes
- 206 Limehouse Dr
- 9875 Jamison Rd
- 212 Two Pond Loop
- 219 Tuscany Ct
- 209 Salterton St
- 3841 Fault Line Dr
- 217 Beverly Dr
- 102 Welwyn Rd
- 101 Alwyn Blvd
- 111 MacFarren Ln
- 186 Two Pond Loop
- 212 Terrace View Dr
- 221 Terrace View Dr
- 222 Terrace View Dr
- 206 Terrace View Dr
- 115 Saint Awdry St
- 112 Jarett Rd
- 162 Robert Dr
- 215 Terrace View Dr
- 1108 Maryland Dr
- 101 Helen Ct
- 100 Helen Ct
- 100 Helen Ln
- 106 Limehouse Dr
- 105 Beverly Dr
- 107 Beverly Dr
- 104 Limehouse Dr
- 104 Sandra Ln
- 102 Sandra Ln
- 108 Limehouse Dr
- 106 Sandra Ln
- 102 Limehouse Dr
- 109 Beverly Dr
- 110 Limehouse Dr
- 108 Sandra Ln
- 111 Beverly Dr
- 100 Limehouse Dr
- 112 Beverly Dr
- 110 Beverly Dr
- 114 Beverly Dr