Estimated Value: $531,000 - $591,101
3
Beds
3
Baths
2,150
Sq Ft
$262/Sq Ft
Est. Value
About This Home
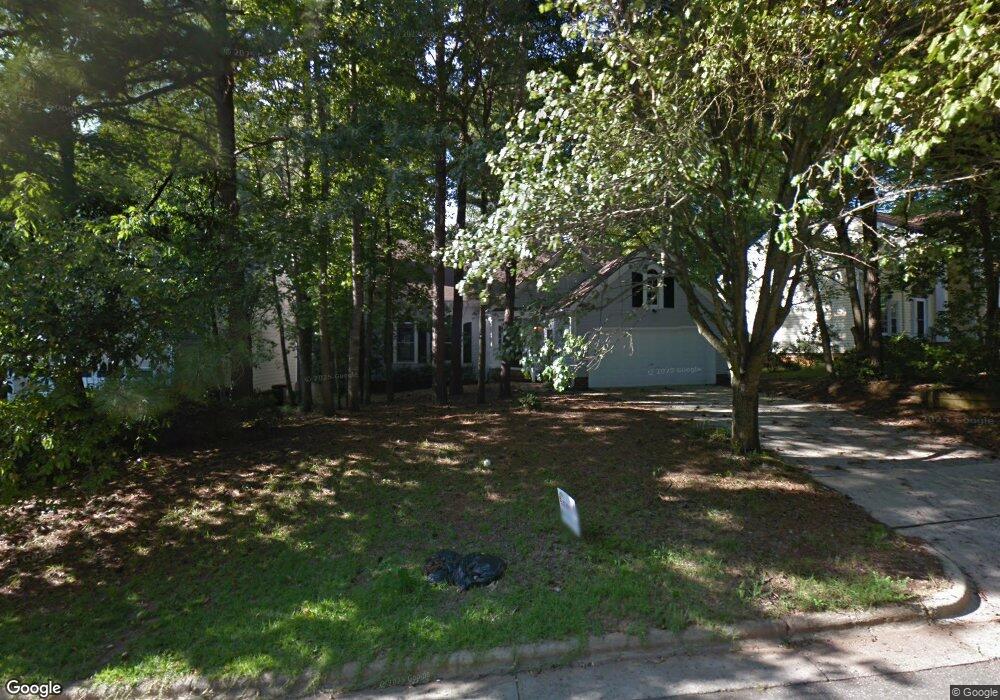
This home is located at 103 Kirkfield Dr, Cary, NC 27518 and is currently estimated at $563,525, approximately $262 per square foot. 103 Kirkfield Dr is a home located in Wake County with nearby schools including Dillard Drive Magnet Elementary School, Dillard Drive Magnet Middle School, and Resurrection Lutheran School.
Ownership History
Date
Name
Owned For
Owner Type
Purchase Details
Closed on
Apr 10, 2018
Sold by
Gauotis Gus George and The Gus Groege Gauotis Revocab
Bought by
Kirchdorfer Norman
Current Estimated Value
Home Financials for this Owner
Home Financials are based on the most recent Mortgage that was taken out on this home.
Original Mortgage
$250,712
Outstanding Balance
$215,908
Interest Rate
4.5%
Mortgage Type
FHA
Estimated Equity
$347,617
Purchase Details
Closed on
Oct 9, 2008
Sold by
Ganotis Gus G
Bought by
Ganotis Gus George and Gus George Ganotis Revocable Trust
Purchase Details
Closed on
Sep 18, 1997
Sold by
Kluczykowski Dennis J
Bought by
Kristof James E and Kristof Shari J
Home Financials for this Owner
Home Financials are based on the most recent Mortgage that was taken out on this home.
Original Mortgage
$160,000
Interest Rate
7.46%
Purchase Details
Closed on
Mar 12, 1987
Bought by
Ganotis, Gus George Trustee
Create a Home Valuation Report for This Property
The Home Valuation Report is an in-depth analysis detailing your home's value as well as a comparison with similar homes in the area
Home Values in the Area
Average Home Value in this Area
Purchase History
| Date | Buyer | Sale Price | Title Company |
|---|---|---|---|
| Kirchdorfer Norman | $266,500 | None Available | |
| Ganotis Gus George | -- | None Available | |
| Kristof James E | $181,000 | -- | |
| Ganotis, Gus George Trustee | $135,000 | -- |
Source: Public Records
Mortgage History
| Date | Status | Borrower | Loan Amount |
|---|---|---|---|
| Open | Kirchdorfer Norman | $250,712 | |
| Previous Owner | Kristof James E | $160,000 |
Source: Public Records
Tax History Compared to Growth
Tax History
| Year | Tax Paid | Tax Assessment Tax Assessment Total Assessment is a certain percentage of the fair market value that is determined by local assessors to be the total taxable value of land and additions on the property. | Land | Improvement |
|---|---|---|---|---|
| 2025 | $4,672 | $542,796 | $175,000 | $367,796 |
| 2024 | $4,571 | $542,796 | $175,000 | $367,796 |
| 2023 | $3,332 | $330,512 | $105,000 | $225,512 |
| 2022 | $3,208 | $330,512 | $105,000 | $225,512 |
| 2021 | $3,143 | $330,512 | $105,000 | $225,512 |
| 2020 | $3,160 | $330,512 | $105,000 | $225,512 |
| 2019 | $2,980 | $276,490 | $98,000 | $178,490 |
| 2018 | $2,797 | $276,490 | $98,000 | $178,490 |
| 2017 | $2,688 | $276,490 | $98,000 | $178,490 |
| 2016 | $2,648 | $276,490 | $98,000 | $178,490 |
| 2015 | $2,782 | $280,575 | $78,000 | $202,575 |
| 2014 | $2,624 | $280,575 | $78,000 | $202,575 |
Source: Public Records
Map
Nearby Homes
- 304 W Kirkfield Dr
- 307 Durington Place
- 2414 Stephens Rd
- 6315 Tryon Rd
- 0 SE Cary Pkwy Unit 2491180
- 1221 Renshaw Ct
- 4311 Wellington Ridge Loop
- 1728 Callandale Ave
- 105 Crosswaite Way
- 2434 Stephens Rd
- 104 Catherwood Place
- 1641 Kildonan Place
- 105 Headlands Ln
- 406 Cricketfield Ln
- 104 Jersey Ridge Rd
- 2015 Piney Plains Rd
- 202 Coltsgate Dr
- 1640 Glengarry Dr
- 210 Coltsgate Dr
- 1331 Kingston Ridge Rd
- 105 Kirkfield Dr
- 101 Kirkfield Dr
- 107 W Laurenbrook Ct
- 105 W Laurenbrook Ct
- 107 Kirkfield Dr
- 102 Kirkfield Dr
- 104 Kirkfield Dr
- 106 Kirkfield Dr
- 109 W Laurenbrook Ct
- 100 Kirkfield Dr
- 109 Kirkfield Dr
- 103 W Laurenbrook Ct
- 108 Kirkfield Dr
- 110 Woodruff Ct
- 102 Woodruff Ct
- 108 Woodruff Ct
- 110 Kirkfield Dr
- 111 W Laurenbrook Ct
- 301 Wellingborough Dr
- 101 W Laurenbrook Ct