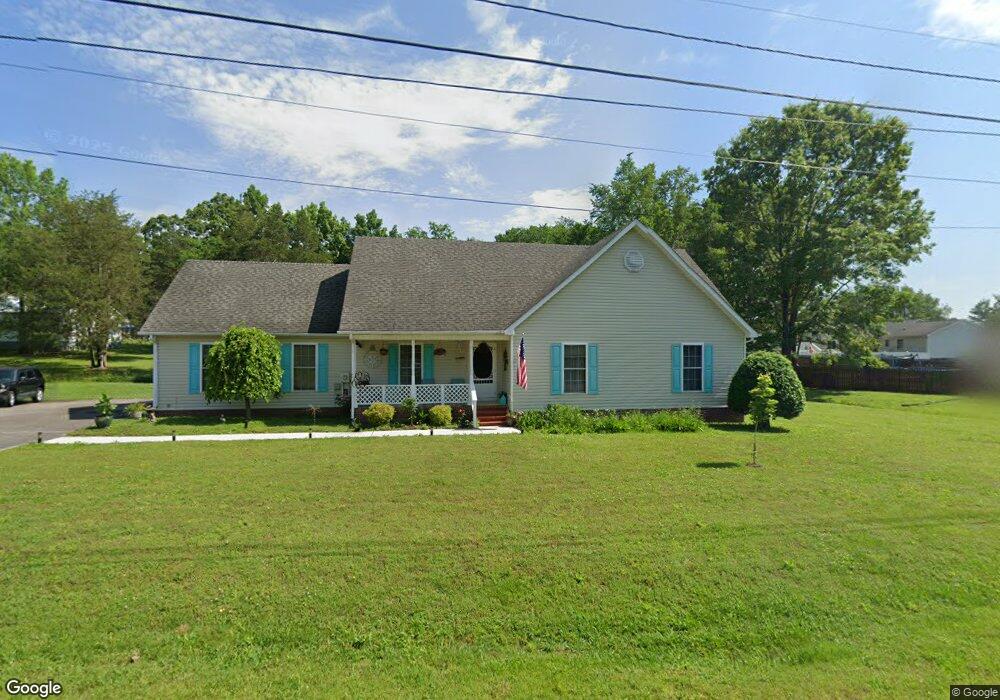
103 Lantern Ln Shelbyville, TN 37160
Estimated Value: $300,916 - $361,000
--
Bed
2
Baths
2,019
Sq Ft
$165/Sq Ft
Est. Value
About This Home
This home is located at 103 Lantern Ln, Shelbyville, TN 37160 and is currently estimated at $332,229, approximately $164 per square foot. 103 Lantern Ln is a home located in Bedford County with nearby schools including South Side Elementary School, Harris Middle School, and Christian Chapel Academy.
Ownership History
Date
Name
Owned For
Owner Type
Purchase Details
Closed on
Jan 21, 2004
Sold by
Sain Carrie
Bought by
Bennett Michael
Current Estimated Value
Home Financials for this Owner
Home Financials are based on the most recent Mortgage that was taken out on this home.
Original Mortgage
$124,996
Outstanding Balance
$57,475
Interest Rate
5.77%
Estimated Equity
$274,754
Purchase Details
Closed on
Oct 1, 2001
Sold by
Grissom Michael D
Bought by
Sain Carrie Ann
Purchase Details
Closed on
Jun 23, 1999
Bought by
Sanders Sain Carrie
Create a Home Valuation Report for This Property
The Home Valuation Report is an in-depth analysis detailing your home's value as well as a comparison with similar homes in the area
Home Values in the Area
Average Home Value in this Area
Purchase History
| Date | Buyer | Sale Price | Title Company |
|---|---|---|---|
| Bennett Michael | $129,600 | -- | |
| Sain Carrie Ann | -- | -- | |
| Sanders Sain Carrie | $8,000 | -- |
Source: Public Records
Mortgage History
| Date | Status | Borrower | Loan Amount |
|---|---|---|---|
| Open | Sanders Sain Carrie | $124,996 |
Source: Public Records
Tax History Compared to Growth
Tax History
| Year | Tax Paid | Tax Assessment Tax Assessment Total Assessment is a certain percentage of the fair market value that is determined by local assessors to be the total taxable value of land and additions on the property. | Land | Improvement |
|---|---|---|---|---|
| 2025 | -- | $54,450 | $0 | $0 |
| 2024 | -- | $54,450 | $7,250 | $47,200 |
| 2023 | $2,072 | $54,450 | $7,250 | $47,200 |
| 2022 | $2,132 | $54,450 | $7,250 | $47,200 |
| 2021 | $1,936 | $54,450 | $7,250 | $47,200 |
| 2020 | $1,624 | $54,450 | $7,250 | $47,200 |
| 2019 | $1,624 | $36,650 | $5,500 | $31,150 |
| 2018 | $1,587 | $36,650 | $5,500 | $31,150 |
| 2017 | $1,587 | $36,650 | $5,500 | $31,150 |
| 2016 | $1,572 | $36,650 | $5,500 | $31,150 |
| 2015 | $1,572 | $36,650 | $5,500 | $31,150 |
| 2014 | $1,297 | $33,099 | $0 | $0 |
Source: Public Records
Map
Nearby Homes