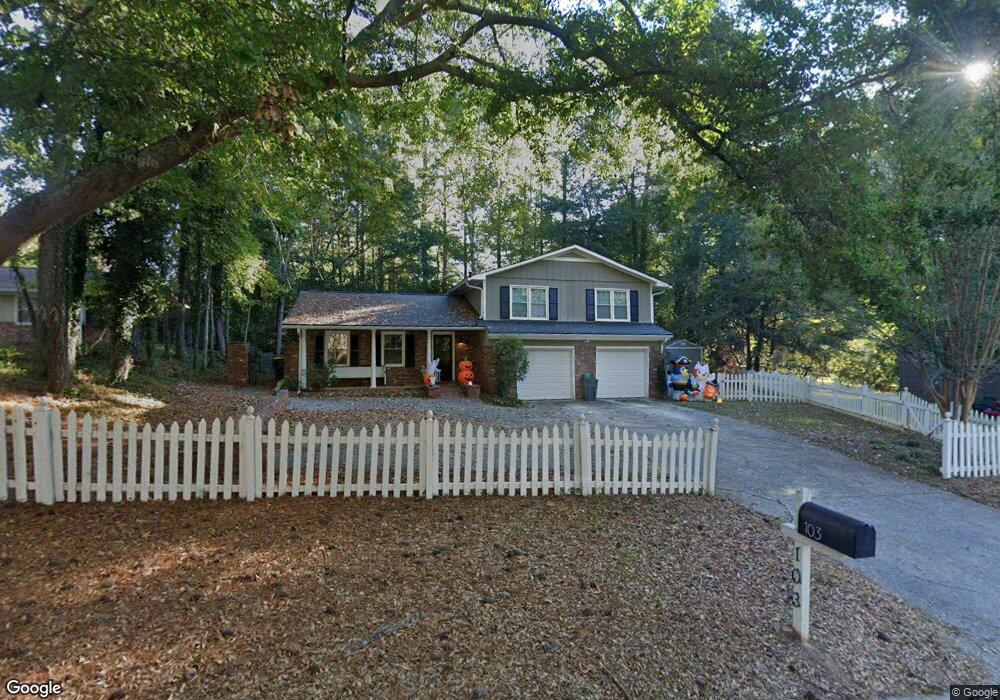
103 Laurel Ct Peachtree City, GA 30269
Estimated Value: $424,652 - $512,000
4
Beds
3
Baths
2,185
Sq Ft
$211/Sq Ft
Est. Value
About This Home
This home is located at 103 Laurel Ct, Peachtree City, GA 30269 and is currently estimated at $461,163, approximately $211 per square foot. 103 Laurel Ct is a home located in Fayette County with nearby schools including Huddleston Elementary School, Booth Middle School, and McIntosh High School.
Ownership History
Date
Name
Owned For
Owner Type
Purchase Details
Closed on
Sep 15, 2020
Sold by
Kimberly Jeffrey S
Bought by
Siuda Mark and Siuda Amanda
Current Estimated Value
Home Financials for this Owner
Home Financials are based on the most recent Mortgage that was taken out on this home.
Original Mortgage
$150,000
Outstanding Balance
$133,115
Interest Rate
2.9%
Mortgage Type
New Conventional
Estimated Equity
$328,048
Purchase Details
Closed on
Aug 15, 2017
Sold by
Kpl Properties Llc
Bought by
Kimberly Jeffrey S and Kimberly Nancy M
Home Financials for this Owner
Home Financials are based on the most recent Mortgage that was taken out on this home.
Original Mortgage
$206,400
Interest Rate
3.96%
Mortgage Type
New Conventional
Purchase Details
Closed on
Mar 21, 2017
Sold by
Davis Jimmie Ann
Bought by
Kpl Properties Llc
Create a Home Valuation Report for This Property
The Home Valuation Report is an in-depth analysis detailing your home's value as well as a comparison with similar homes in the area
Home Values in the Area
Average Home Value in this Area
Purchase History
| Date | Buyer | Sale Price | Title Company |
|---|---|---|---|
| Siuda Mark | $322,500 | -- | |
| Kimberly Jeffrey S | $258,000 | -- | |
| Kpl Properties Llc | $170,000 | -- |
Source: Public Records
Mortgage History
| Date | Status | Borrower | Loan Amount |
|---|---|---|---|
| Open | Siuda Mark | $150,000 | |
| Previous Owner | Kimberly Jeffrey S | $206,400 |
Source: Public Records
Tax History Compared to Growth
Tax History
| Year | Tax Paid | Tax Assessment Tax Assessment Total Assessment is a certain percentage of the fair market value that is determined by local assessors to be the total taxable value of land and additions on the property. | Land | Improvement |
|---|---|---|---|---|
| 2024 | $3,369 | $151,412 | $22,000 | $129,412 |
| 2023 | $2,853 | $145,120 | $22,000 | $123,120 |
| 2022 | $3,269 | $140,000 | $22,000 | $118,000 |
| 2021 | $3,104 | $125,600 | $22,000 | $103,600 |
| 2020 | $3,579 | $117,240 | $12,000 | $105,240 |
| 2019 | $3,574 | $115,940 | $14,700 | $101,240 |
| 2018 | $3,012 | $96,500 | $13,580 | $82,920 |
| 2017 | $2,727 | $85,020 | $13,300 | $71,720 |
| 2016 | $895 | $75,500 | $13,300 | $62,200 |
| 2015 | $835 | $69,260 | $13,300 | $55,960 |
| 2014 | $1,509 | $65,100 | $13,300 | $51,800 |
| 2013 | -- | $63,100 | $0 | $0 |
Source: Public Records
Map
Nearby Homes
- 124 Hickory Dr
- 213 Cedar Dr
- 4 & 5 Northlake Cir
- 709 Cove Rd
- 107 Presidio Park
- 217 Hilltop Dr
- 101 Bluegill Trace
- 228 Terrane Ridge
- 444 Seabiscuit Walk Unit 55
- 442 Seabiscuit Walk
- 440 Seabiscuit Walk
- 164 Twiggs Corner
- 445 Seabisuit Walk
- 319 Ruffian Cir Unit 71
- 313 Ruffian Cir Unit 74
- 317 Ruffian Cir Unit 72
- 321 Ruffian Cir Unit 70
- 102 Spincast Ct
- 401 Peachtree Club Dr
- 244 Terrane Ridge
- 101 Laurel Ct
- 0 Laurel Ct Unit 7446863
- 0 Laurel Ct Unit 7279194
- 0 Laurel Ct Unit 8224303
- 0 Laurel Ct Unit 8124599
- 105 Laurel Ct
- 1100 Hip Pocket Rd
- 132 Azalea Dr
- 104 Laurel Ct
- 107 Laurel Ct
- 1104 Hip Pocket Rd
- 117 Hickory Dr
- 130 Azalea Dr
- 123 Azalea Dr
- 106 Laurel Ct
- 122 Hickory Dr
- 1101 Hip Pocket Rd
- 914 Hip Pocket Rd
- 128 Azalea Dr
- 111 Laurel Ct