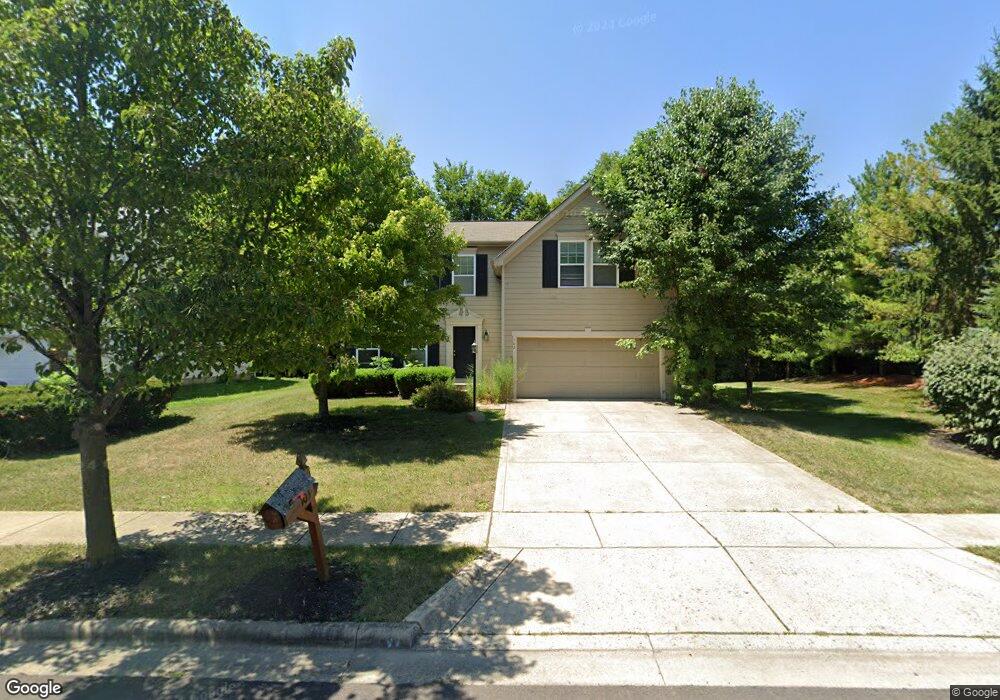
103 Leasure Dr Unit 1 Pickerington, OH 43147
Estimated Value: $417,630 - $457,000
3
Beds
3
Baths
2,151
Sq Ft
$204/Sq Ft
Est. Value
About This Home
This home is located at 103 Leasure Dr Unit 1, Pickerington, OH 43147 and is currently estimated at $437,908, approximately $203 per square foot. 103 Leasure Dr Unit 1 is a home located in Fairfield County with nearby schools including Pickerington Elementary School, Diley Middle School, and Pickerington Ridgeview Junior High School.
Ownership History
Date
Name
Owned For
Owner Type
Purchase Details
Closed on
Feb 10, 2015
Sold by
Parks Keisha and Lakeview Loan Servicing Llc
Bought by
Amercian Home 4 Rent Properties Seven Ll
Current Estimated Value
Purchase Details
Closed on
Nov 4, 2009
Sold by
Fischer Single Family Homes Ii Llc
Bought by
Parks Keisha
Home Financials for this Owner
Home Financials are based on the most recent Mortgage that was taken out on this home.
Original Mortgage
$157,091
Interest Rate
4.9%
Mortgage Type
FHA
Purchase Details
Closed on
Mar 25, 2009
Sold by
Fischer Development Company
Bought by
Fischer Single Family Homes Ii Llc
Purchase Details
Closed on
Sep 30, 2008
Sold by
Beazer Homes Investments Llc
Bought by
Fischer Development Company
Create a Home Valuation Report for This Property
The Home Valuation Report is an in-depth analysis detailing your home's value as well as a comparison with similar homes in the area
Home Values in the Area
Average Home Value in this Area
Purchase History
| Date | Buyer | Sale Price | Title Company |
|---|---|---|---|
| Amercian Home 4 Rent Properties Seven Ll | $184,681 | Attorney | |
| Parks Keisha | $160,000 | Attorney | |
| Fischer Single Family Homes Ii Llc | $11,700 | Attorney | |
| Fischer Development Company | $40,000 | Stewart Title Agency Of Colu |
Source: Public Records
Mortgage History
| Date | Status | Borrower | Loan Amount |
|---|---|---|---|
| Previous Owner | Parks Keisha | $157,091 |
Source: Public Records
Tax History
| Year | Tax Paid | Tax Assessment Tax Assessment Total Assessment is a certain percentage of the fair market value that is determined by local assessors to be the total taxable value of land and additions on the property. | Land | Improvement |
|---|---|---|---|---|
| 2025 | $13,285 | $137,340 | $40,570 | $96,770 |
| 2024 | $13,285 | $107,920 | $16,770 | $91,150 |
| 2023 | $5,212 | $107,920 | $16,770 | $91,150 |
| 2022 | $5,229 | $107,920 | $16,770 | $91,150 |
| 2021 | $4,721 | $82,920 | $14,060 | $68,860 |
| 2020 | $4,773 | $82,920 | $14,060 | $68,860 |
| 2019 | $4,803 | $82,920 | $14,060 | $68,860 |
| 2018 | $4,504 | $67,640 | $14,060 | $53,580 |
| 2017 | $4,511 | $67,740 | $14,190 | $53,550 |
| 2016 | $4,490 | $67,740 | $14,190 | $53,550 |
| 2015 | $3,725 | $53,140 | $10,140 | $43,000 |
| 2014 | $3,682 | $53,140 | $10,140 | $43,000 |
| 2013 | $3,682 | $53,140 | $10,140 | $43,000 |
Source: Public Records
Map
Nearby Homes
- 113 Urich Dr
- 140 Robinette St
- 291 Sterndale Dr
- 136 Pioneer Cir
- 148 Lorrimore Dr
- 149 Lorrimore Dr
- 155 Lorrimore Dr
- 157 Lorrimore Dr
- 148 Georges Creek Dr
- 167 Lorrimore Dr
- 250 Sterndale Dr
- 213 Sterndale Dr
- 139 Knights Bridge Dr N
- 43 Langtree Dr
- 287 Crestview Ln
- 760 N Starr Dr
- 176 Knights Bridge Dr E
- 780 Diley Rd
- 559 Cherry Hill Dr
- 292 Maple Place
- 103 Leasure Dr
- 107 Leasure Dr
- 111 Leasure Dr
- 111 Leasure Dr Unit LA03
- 115 Leasure Dr
- 115 Leasure Dr
- 115 Leasure Dr Unit 4
- 10437 Long Rd
- 10505 Long Rd
- 104 Leasure Dr
- 119 Leasure Dr
- 119 Leasure Dr Unit LA05
- 105 Urich Dr Unit 1
- 105 Urich Dr
- 240 Pioneer Cir Unit 240
- 108 Leasure Dr
- 123 Leasure Dr
- 244 Pioneer Cir Unit 244
- 238 Pioneer Cir Unit 238
- 10539 Long Rd
Your Personal Tour Guide
Ask me questions while you tour the home.