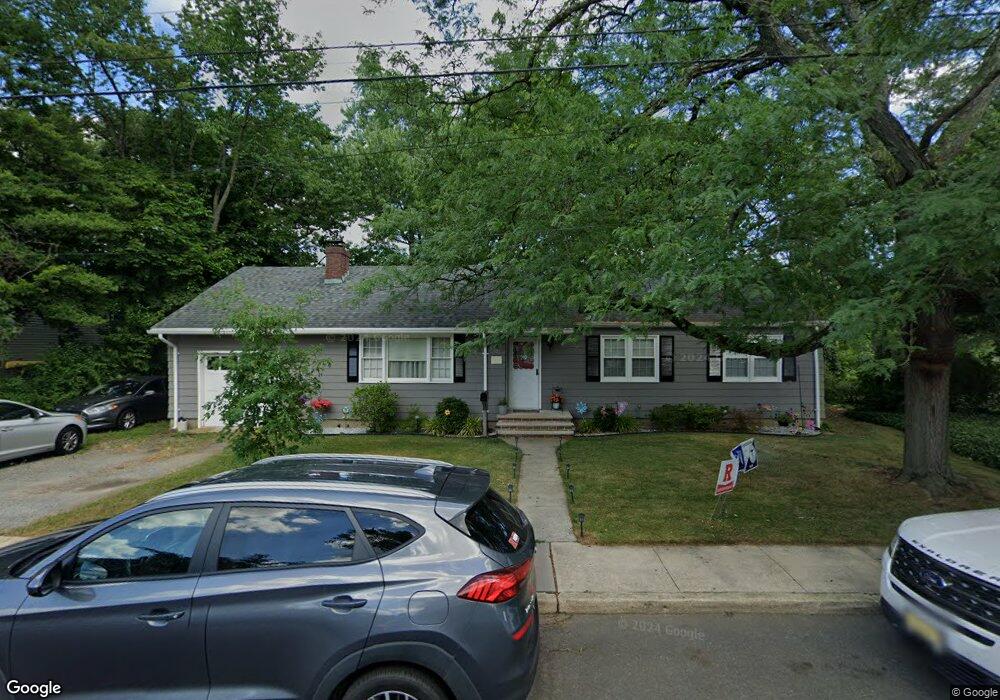
103 Luppatatong Ave Keyport, NJ 07735
Estimated Value: $495,000 - $556,638
3
Beds
2
Baths
1,340
Sq Ft
$392/Sq Ft
Est. Value
About This Home
This home is located at 103 Luppatatong Ave, Keyport, NJ 07735 and is currently estimated at $524,910, approximately $391 per square foot. 103 Luppatatong Ave is a home located in Monmouth County with nearby schools including Keyport Central School, Keyport High School, and Icob Academy.
Ownership History
Date
Name
Owned For
Owner Type
Purchase Details
Closed on
Oct 30, 1998
Sold by
Mount Robert
Bought by
Aumack James and Aumack Dorothy
Current Estimated Value
Home Financials for this Owner
Home Financials are based on the most recent Mortgage that was taken out on this home.
Original Mortgage
$128,374
Outstanding Balance
$28,243
Interest Rate
6.68%
Mortgage Type
FHA
Estimated Equity
$496,667
Create a Home Valuation Report for This Property
The Home Valuation Report is an in-depth analysis detailing your home's value as well as a comparison with similar homes in the area
Home Values in the Area
Average Home Value in this Area
Purchase History
| Date | Buyer | Sale Price | Title Company |
|---|---|---|---|
| Aumack James | $130,000 | -- |
Source: Public Records
Mortgage History
| Date | Status | Borrower | Loan Amount |
|---|---|---|---|
| Open | Aumack James | $128,374 |
Source: Public Records
Tax History Compared to Growth
Tax History
| Year | Tax Paid | Tax Assessment Tax Assessment Total Assessment is a certain percentage of the fair market value that is determined by local assessors to be the total taxable value of land and additions on the property. | Land | Improvement |
|---|---|---|---|---|
| 2025 | $8,508 | $456,200 | $280,800 | $175,400 |
| 2024 | $8,341 | $411,000 | $244,200 | $166,800 |
| 2023 | $8,341 | $379,500 | $222,000 | $157,500 |
| 2022 | $7,400 | $330,000 | $193,100 | $136,900 |
| 2021 | $7,400 | $293,200 | $178,800 | $114,400 |
| 2020 | $7,174 | $282,100 | $173,300 | $108,800 |
| 2019 | $6,964 | $274,300 | $168,000 | $106,300 |
| 2018 | $6,955 | $267,500 | $168,000 | $99,500 |
| 2017 | $6,809 | $261,200 | $163,000 | $98,200 |
| 2016 | $6,718 | $259,900 | $163,000 | $96,900 |
| 2015 | $6,326 | $243,600 | $148,000 | $95,600 |
| 2014 | $5,993 | $233,000 | $126,200 | $106,800 |
Source: Public Records
Map
Nearby Homes
- 54 Chingarora Ave
- 127 Chingarora Ave
- 253 Broadway
- 8 Chingarora Ave
- 95 Broadway
- 1 Hobart St
- 52 Highway 35
- 9 Monmouth Place
- 324 Maple Place
- 90 Saint Peters Place
- 22 Lower Main St
- 226 Osborn St
- 195 Atlantic St
- 369 Riverdale Dr
- 87 Church St
- 40 Church St
- 557 Lloyd Rd Unit B
- 231 Atlantic St Unit 23
- 47 Village Green Way
- 25-27 Brook Ave
- 105 Luppatatong Ave
- 101 Luppatatong Ave
- 99 Luppatatong Ave
- 104 Luppatatong Ave
- 102 Luppatatong Ave
- 115 Luppatatong Ave
- 213 Maple Place
- 213 Maple Place Unit A, 1st Flr
- 213 Maple Place Unit A
- 213 Maple Place Unit B
- 106 Luppatatong Ave
- 98 Luppatatong Ave
- 87 Chingarora Ave
- 85 Chingarora Ave
- 110 Luppatatong Ave
- 221 Maple Place
- 221 Maple Place Unit 3
- 221 Maple Place Unit 2
- 221 Maple Place Unit 1
- 95 Chingarora Ave