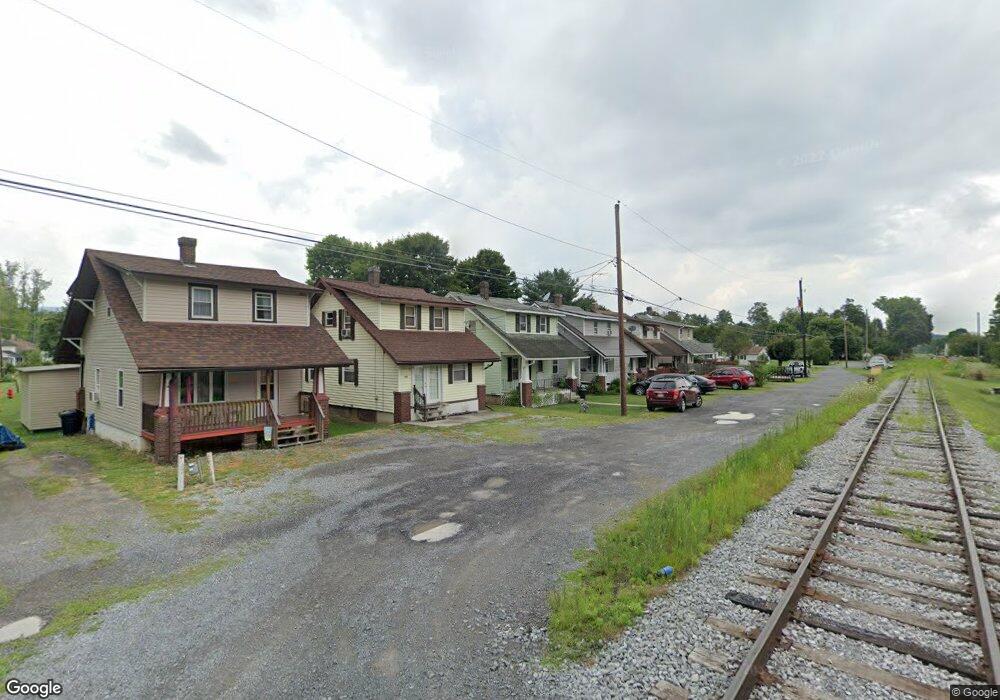
103 Mainline Alley Claysburg, PA 16625
Estimated Value: $86,000 - $102,000
2
Beds
1
Bath
1,116
Sq Ft
$83/Sq Ft
Est. Value
About This Home
This home is located at 103 Mainline Alley, Claysburg, PA 16625 and is currently estimated at $93,103, approximately $83 per square foot. 103 Mainline Alley is a home located in Blair County with nearby schools including Claysburg-Kimmel Elementary School and Claysburg-Kimmel High School.
Ownership History
Date
Name
Owned For
Owner Type
Purchase Details
Closed on
Dec 8, 2011
Sold by
Secretary Of Housing & Urban Development
Bought by
Musselman Bryan T and Musselman Michelle Li
Current Estimated Value
Purchase Details
Closed on
May 24, 2011
Sold by
U S Bank National Association
Bought by
The Secretary Of Housing & Urban Develop
Purchase Details
Closed on
May 10, 2011
Sold by
Baker Dustin L
Bought by
U S Bank National Association and The Pennsylvania Housing Finance Agency
Purchase Details
Closed on
Feb 27, 2008
Sold by
Foor Daphanie C and Foor Dale E
Bought by
Baker Dustin L
Home Financials for this Owner
Home Financials are based on the most recent Mortgage that was taken out on this home.
Original Mortgage
$53,576
Interest Rate
5.8%
Mortgage Type
FHA
Purchase Details
Closed on
Aug 10, 2007
Sold by
Strayer Vincent E and Strayer Betsy L
Bought by
Foor Daphanie C and Foor Dale E
Create a Home Valuation Report for This Property
The Home Valuation Report is an in-depth analysis detailing your home's value as well as a comparison with similar homes in the area
Home Values in the Area
Average Home Value in this Area
Purchase History
| Date | Buyer | Sale Price | Title Company |
|---|---|---|---|
| Musselman Bryan T | $16,000 | None Available | |
| The Secretary Of Housing & Urban Develop | -- | None Available | |
| U S Bank National Association | $2,910 | None Available | |
| Baker Dustin L | $54,000 | Realty Abstrct Services Inc | |
| Foor Daphanie C | $19,000 | None Available |
Source: Public Records
Mortgage History
| Date | Status | Borrower | Loan Amount |
|---|---|---|---|
| Previous Owner | Baker Dustin L | $53,576 |
Source: Public Records
Tax History Compared to Growth
Tax History
| Year | Tax Paid | Tax Assessment Tax Assessment Total Assessment is a certain percentage of the fair market value that is determined by local assessors to be the total taxable value of land and additions on the property. | Land | Improvement |
|---|---|---|---|---|
| 2025 | $1,204 | $78,900 | $10,000 | $68,900 |
| 2024 | $1,125 | $78,900 | $10,000 | $68,900 |
| 2023 | $1,070 | $78,900 | $10,000 | $68,900 |
| 2022 | $1,034 | $78,900 | $10,000 | $68,900 |
| 2021 | $1,007 | $78,900 | $10,000 | $68,900 |
| 2020 | $980 | $78,900 | $10,000 | $68,900 |
| 2019 | $1,130 | $78,900 | $10,000 | $68,900 |
| 2018 | $973 | $78,900 | $10,000 | $68,900 |
| 2017 | $7,294 | $78,900 | $10,000 | $68,900 |
| 2016 | $147 | $3,680 | $140 | $3,540 |
| 2015 | $147 | $3,680 | $140 | $3,540 |
| 2014 | $147 | $3,680 | $140 | $3,540 |
Source: Public Records
Map
Nearby Homes
- 00 Ridge Run Rd Unit Lot 227
- 00 Ridge Run Rd Unit Lot 226
- 00 Ridge Run Rd Unit Lot 167
- 00 Iron Masters Rd Unit Lot 275
- 00 Iron Masters Rd Unit Lot 128
- 106 Arden St
- 13588 Dunnings Hwy
- 413 Metzgar Ln Unit 14
- 1429 Everett Rd
- 0 Dunnings Hwy Unit 63202
- 000 Lot 312 Ridge Run
- 000 Lot 320 Ridge Run
- 195 Mill Rd
- 129 Feathers Court Rd
- 454 Bolger Dr
- Parcel B Lockards Ln
- 0 Weyant Farm Ln
- 452 Shawnee Dr
- 932 Beech St
- 0 Lot 312 Ridge Run Unit PABR2000104
- 101 Mainline Alley
- 105 Mainline Alley
- 107 Mainline Alley
- 111 Mainline Alley
- 113 Mainline Alley
- 117 Mainline Alley
- 801 Bedford St
- 779 Bedford St
- 769 and and 775 Bedford St
- 769 and 773 and 775 Bedford St
- 125 Mainline Alley
- 805 Bedford St
- 773 Bedford St Unit B
- 773 Bedford St Unit A
- 139 Hoover Ln
- 769 Bedford St
- 792 Bedford St
- 816 Bedford St
- 784 Bedford St
- 819 Bedford St