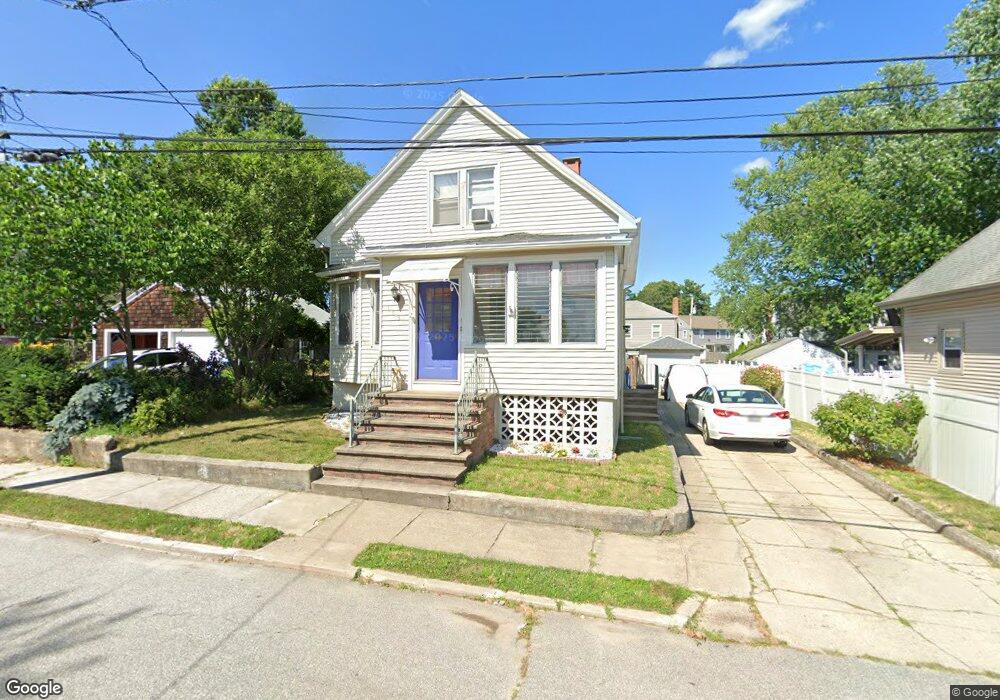
103 Mauran St Cranston, RI 02910
Auburn NeighborhoodEstimated Value: $386,297 - $464,000
2
Beds
2
Baths
1,747
Sq Ft
$237/Sq Ft
Est. Value
About This Home
This home is located at 103 Mauran St, Cranston, RI 02910 and is currently estimated at $414,074, approximately $237 per square foot. 103 Mauran St is a home located in Providence County with nearby schools including W. R. Dutemple School, Park View Middle School, and Cranston High School East.
Ownership History
Date
Name
Owned For
Owner Type
Purchase Details
Closed on
Sep 2, 2014
Sold by
Caldarone John J
Bought by
Caldarone John J and Caldarone Mary E
Current Estimated Value
Purchase Details
Closed on
Nov 9, 2011
Sold by
Cuna Michael S
Bought by
Caldarone John J and Caldarone Mary E
Purchase Details
Closed on
Aug 11, 2011
Sold by
Caldarone John J and Caldarone Mary E
Bought by
Cunha Michael S
Purchase Details
Closed on
Dec 8, 2000
Sold by
Rappoport Harold and Rappoport Evelyn
Bought by
Caldarone John J and Caldarone Mary E
Create a Home Valuation Report for This Property
The Home Valuation Report is an in-depth analysis detailing your home's value as well as a comparison with similar homes in the area
Home Values in the Area
Average Home Value in this Area
Purchase History
| Date | Buyer | Sale Price | Title Company |
|---|---|---|---|
| Caldarone John J | $2,323 | -- | |
| Caldarone John J | -- | -- | |
| Cunha Michael S | $1,849 | -- | |
| Caldarone John J | $109,000 | -- |
Source: Public Records
Mortgage History
| Date | Status | Borrower | Loan Amount |
|---|---|---|---|
| Previous Owner | Caldarone John J | $233,750 | |
| Previous Owner | Caldarone John J | $320,000 | |
| Previous Owner | Caldarone John J | $195,500 |
Source: Public Records
Tax History
| Year | Tax Paid | Tax Assessment Tax Assessment Total Assessment is a certain percentage of the fair market value that is determined by local assessors to be the total taxable value of land and additions on the property. | Land | Improvement |
|---|---|---|---|---|
| 2025 | $4,260 | $306,900 | $102,000 | $204,900 |
| 2024 | $4,177 | $306,900 | $102,000 | $204,900 |
| 2023 | $4,041 | $213,800 | $70,400 | $143,400 |
| 2022 | $3,957 | $213,800 | $70,400 | $143,400 |
| 2021 | $3,848 | $213,800 | $70,400 | $143,400 |
| 2020 | $3,909 | $188,200 | $73,700 | $114,500 |
| 2019 | $3,909 | $188,200 | $73,700 | $114,500 |
| 2018 | $3,819 | $188,200 | $73,700 | $114,500 |
| 2017 | $3,725 | $162,400 | $67,000 | $95,400 |
| 2016 | $3,646 | $162,400 | $67,000 | $95,400 |
| 2015 | $3,646 | $162,400 | $67,000 | $95,400 |
| 2014 | $3,545 | $155,200 | $67,000 | $88,200 |
Source: Public Records
Map
Nearby Homes
Your Personal Tour Guide
Ask me questions while you tour the home.