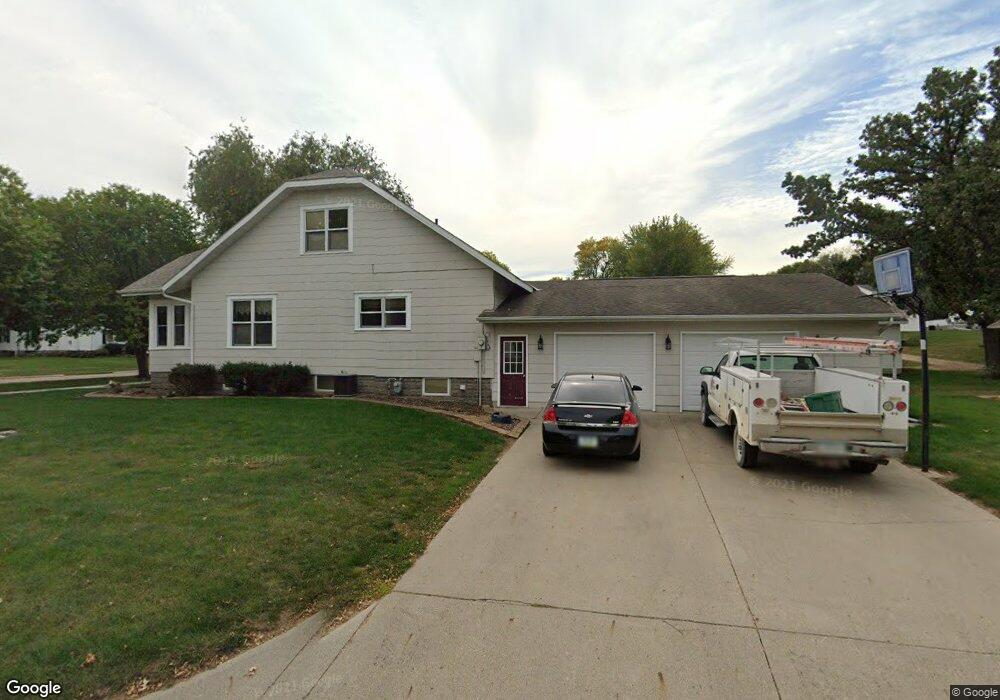
103 May St Manning, IA 51455
Estimated Value: $151,000 - $238,000
3
Beds
4
Baths
1,380
Sq Ft
$133/Sq Ft
Est. Value
About This Home
This home is located at 103 May St, Manning, IA 51455 and is currently estimated at $183,880, approximately $133 per square foot. 103 May St is a home with nearby schools including IKM-Manning Middle School, Ikm-Manning High School, and Irwin Elementary School.
Ownership History
Date
Name
Owned For
Owner Type
Purchase Details
Closed on
Jul 1, 2023
Sold by
Haubrich Austin J and Haubrich Trisha
Bought by
Schellhorn Ryan D and Schellhorn Jessica J
Current Estimated Value
Purchase Details
Closed on
Nov 30, 2020
Sold by
Vennink Tom M
Bought by
Haubrich Austin J
Home Financials for this Owner
Home Financials are based on the most recent Mortgage that was taken out on this home.
Original Mortgage
$81,000
Interest Rate
2.8%
Mortgage Type
New Conventional
Create a Home Valuation Report for This Property
The Home Valuation Report is an in-depth analysis detailing your home's value as well as a comparison with similar homes in the area
Purchase History
| Date | Buyer | Sale Price | Title Company |
|---|---|---|---|
| Schellhorn Ryan D | $220,000 | None Listed On Document | |
| Haubrich Austin J | $90,000 | None Available |
Source: Public Records
Mortgage History
| Date | Status | Borrower | Loan Amount |
|---|---|---|---|
| Previous Owner | Haubrich Austin J | $81,000 |
Source: Public Records
Tax History
| Year | Tax Paid | Tax Assessment Tax Assessment Total Assessment is a certain percentage of the fair market value that is determined by local assessors to be the total taxable value of land and additions on the property. | Land | Improvement |
|---|---|---|---|---|
| 2025 | $1,334 | $164,150 | $12,860 | $151,290 |
| 2024 | $13 | $90,780 | $12,860 | $77,920 |
| 2023 | $1,652 | $90,780 | $12,860 | $77,920 |
| 2022 | $1,628 | $98,960 | $11,030 | $87,930 |
| 2021 | $1,628 | $98,960 | $11,030 | $87,930 |
| 2020 | $1,510 | $98,960 | $11,030 | $87,930 |
| 2019 | $1,408 | $98,960 | $11,030 | $87,930 |
| 2018 | $1,342 | $98,960 | $11,030 | $87,930 |
| 2017 | $1,292 | $89,580 | $8,656 | $80,924 |
| 2016 | $1,246 | $83,720 | $0 | $0 |
| 2015 | $1,246 | $76,300 | $0 | $0 |
| 2014 | $1,130 | $76,300 | $0 | $0 |
Source: Public Records
Map
Nearby Homes
Your Personal Tour Guide
Ask me questions while you tour the home.