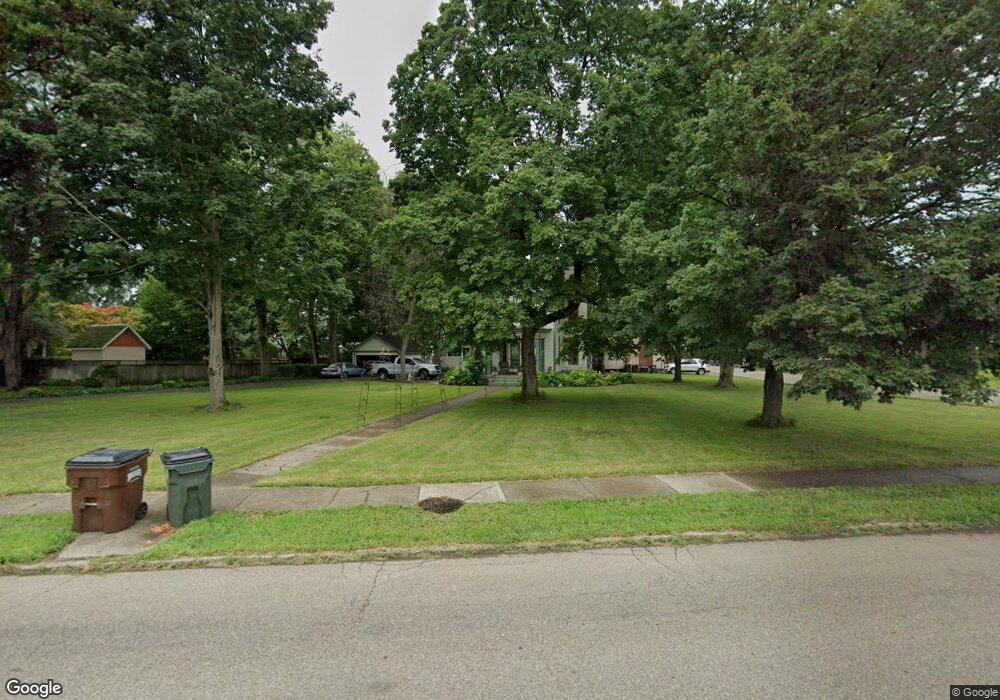
103 Miami Ave Franklin, OH 45005
Estimated Value: $301,228 - $346,000
4
Beds
2
Baths
2,456
Sq Ft
$130/Sq Ft
Est. Value
About This Home
This home is located at 103 Miami Ave, Franklin, OH 45005 and is currently estimated at $318,307, approximately $129 per square foot. 103 Miami Ave is a home located in Warren County with nearby schools including Franklin High School and The CinDay Academy.
Ownership History
Date
Name
Owned For
Owner Type
Purchase Details
Closed on
Apr 19, 2017
Sold by
Bour Peter T
Bought by
Bour Malinda S
Current Estimated Value
Purchase Details
Closed on
Jun 18, 1997
Sold by
Hoksch Steven P
Bought by
Bour Peter T and Bour S
Home Financials for this Owner
Home Financials are based on the most recent Mortgage that was taken out on this home.
Original Mortgage
$130,625
Outstanding Balance
$18,741
Interest Rate
8.01%
Mortgage Type
New Conventional
Estimated Equity
$299,566
Purchase Details
Closed on
Sep 12, 1991
Sold by
Morgan Russell E and Morgan Mabel
Bought by
Hoksch and Hoksch Steven P
Purchase Details
Closed on
Feb 22, 1989
Sold by
Morton Morton and Morton Robert E
Bought by
Morgan Morgan and Morgan Russell E
Purchase Details
Closed on
May 18, 1979
Sold by
Tewell Tewell and Tewell John H
Create a Home Valuation Report for This Property
The Home Valuation Report is an in-depth analysis detailing your home's value as well as a comparison with similar homes in the area
Home Values in the Area
Average Home Value in this Area
Purchase History
| Date | Buyer | Sale Price | Title Company |
|---|---|---|---|
| Bour Malinda S | $16,667 | None Available | |
| Bour Peter T | $137,500 | -- | |
| Hoksch | $114,900 | -- | |
| Morgan Morgan | $85,000 | -- | |
| -- | $75,000 | -- |
Source: Public Records
Mortgage History
| Date | Status | Borrower | Loan Amount |
|---|---|---|---|
| Open | Bour Peter T | $130,625 |
Source: Public Records
Tax History Compared to Growth
Tax History
| Year | Tax Paid | Tax Assessment Tax Assessment Total Assessment is a certain percentage of the fair market value that is determined by local assessors to be the total taxable value of land and additions on the property. | Land | Improvement |
|---|---|---|---|---|
| 2024 | $4,419 | $82,840 | $27,970 | $54,870 |
| 2023 | $3,597 | $63,031 | $18,508 | $44,523 |
| 2022 | $3,532 | $63,032 | $18,508 | $44,524 |
| 2021 | $3,438 | $63,032 | $18,508 | $44,524 |
| 2020 | $3,146 | $50,425 | $14,809 | $35,616 |
| 2019 | $2,894 | $50,425 | $14,809 | $35,616 |
| 2018 | $2,898 | $50,425 | $14,809 | $35,616 |
| 2017 | $3,014 | $49,357 | $14,693 | $34,664 |
| 2016 | $2,988 | $49,357 | $14,693 | $34,664 |
| 2015 | $2,988 | $49,357 | $14,693 | $34,664 |
| 2014 | $2,806 | $49,360 | $14,690 | $34,660 |
| 2013 | $2,409 | $55,270 | $16,450 | $38,820 |
Source: Public Records
Map
Nearby Homes
- 1504 Knightsbridge Ct
- 105 Chestnut St Unit 1
- 605 Spring Ave
- 0 E 4th St
- 315 Bridge St
- 213 Locust St
- 521 S Main St
- 627 S River St
- 631 S River St
- 0 Victoria Dr Unit 1852824
- 0 Victoria Dr Unit 942075
- 102 Warren Ave
- 519 Anderson St
- 233 S Main St
- 235 S Main St
- 7 Highland St
- 121 E 5th St
- 1200 Riley Blvd
- 820 S River St
- 551 E 2nd St