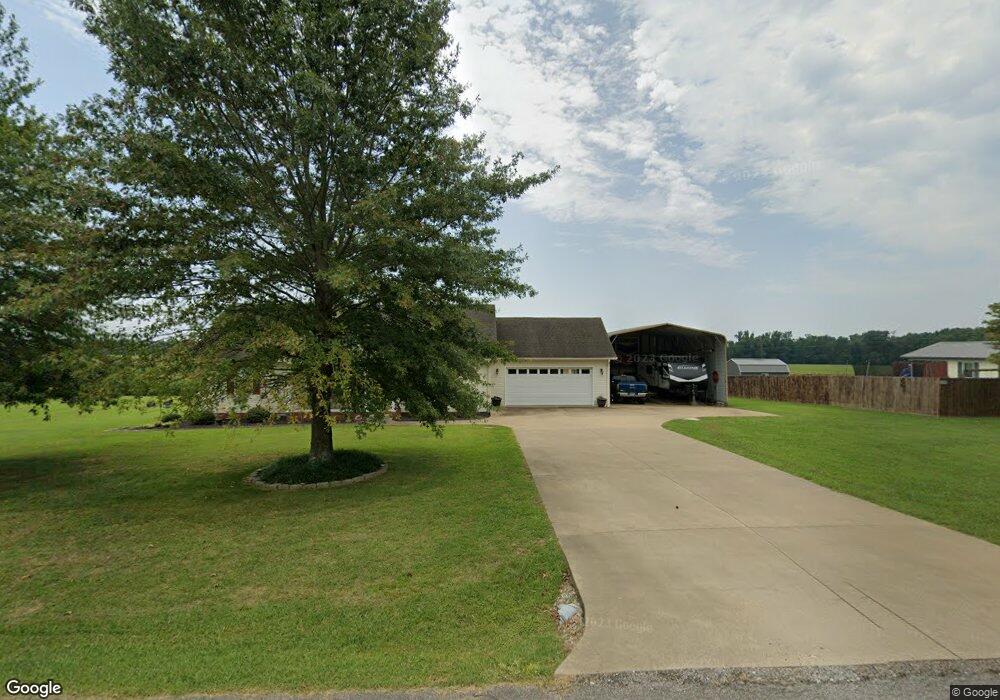
103 Michael Cir Lawrenceburg, TN 38464
Estimated Value: $259,000 - $296,000
--
Bed
2
Baths
1,421
Sq Ft
$191/Sq Ft
Est. Value
About This Home
This home is located at 103 Michael Cir, Lawrenceburg, TN 38464 and is currently estimated at $270,872, approximately $190 per square foot. 103 Michael Cir is a home located in Lawrence County with nearby schools including Ingram Sowell Elementary School, Lawrenceburg Public Elementary School, and David Crockett Elementary School.
Ownership History
Date
Name
Owned For
Owner Type
Purchase Details
Closed on
May 2, 2006
Sold by
Griepenstroh Bruce A
Bought by
Gray Joel D
Current Estimated Value
Home Financials for this Owner
Home Financials are based on the most recent Mortgage that was taken out on this home.
Original Mortgage
$95,000
Outstanding Balance
$54,499
Interest Rate
6.33%
Estimated Equity
$216,373
Purchase Details
Closed on
Jan 31, 2000
Sold by
Crouch Bobby H and Crouch Nell
Bought by
Griepenstroh Bruce A and Griepenstroh Ang
Purchase Details
Closed on
May 6, 1999
Sold by
Crouch Bobby H and Crouch Nell
Bought by
Missack Mark and Missack Melody
Purchase Details
Closed on
Apr 9, 1996
Sold by
Mckissack Mark and Mckissack Melody
Bought by
Crouch Bobby and Crouch Nell
Purchase Details
Closed on
Dec 13, 1995
Bought by
Mckissack Mark and Mckissack Melody
Purchase Details
Closed on
Apr 7, 1986
Bought by
Walls Jeff and Walls Carol
Create a Home Valuation Report for This Property
The Home Valuation Report is an in-depth analysis detailing your home's value as well as a comparison with similar homes in the area
Home Values in the Area
Average Home Value in this Area
Purchase History
| Date | Buyer | Sale Price | Title Company |
|---|---|---|---|
| Gray Joel D | $95,000 | -- | |
| Griepenstroh Bruce A | $90,000 | -- | |
| Missack Mark | $4,500 | -- | |
| Crouch Bobby | $6,500 | -- | |
| Mckissack Mark | $71,000 | -- | |
| Walls Jeff | $3,500 | -- |
Source: Public Records
Mortgage History
| Date | Status | Borrower | Loan Amount |
|---|---|---|---|
| Open | Walls Jeff | $95,000 |
Source: Public Records
Tax History Compared to Growth
Tax History
| Year | Tax Paid | Tax Assessment Tax Assessment Total Assessment is a certain percentage of the fair market value that is determined by local assessors to be the total taxable value of land and additions on the property. | Land | Improvement |
|---|---|---|---|---|
| 2025 | $1,099 | $54,675 | $0 | $0 |
| 2024 | $1,099 | $54,675 | $5,000 | $49,675 |
| 2023 | $1,099 | $54,675 | $5,000 | $49,675 |
| 2022 | $1,099 | $54,675 | $5,000 | $49,675 |
| 2021 | $886 | $29,950 | $2,500 | $27,450 |
| 2020 | $886 | $29,950 | $2,500 | $27,450 |
| 2019 | $886 | $29,950 | $2,500 | $27,450 |
| 2018 | $886 | $29,950 | $2,500 | $27,450 |
| 2017 | $886 | $29,950 | $2,500 | $27,450 |
| 2016 | $886 | $29,950 | $2,500 | $27,450 |
| 2015 | $820 | $29,950 | $2,500 | $27,450 |
| 2014 | $776 | $28,350 | $2,500 | $25,850 |
Source: Public Records
Map
Nearby Homes
- 1950 Norton Rd
- 206 State Ave
- 2600 Clanton Rd
- 380 Lanning Rd
- 260 Wesley Chapel Rd
- 2073 Choates Creek Rd
- 729 Weakley Creek Rd
- 2342 Pulaski Hwy
- 145 Lantz Rd
- 1194 Harmony Way
- 786 Hillview Dr
- 111 Grandview Dr
- 79 Bishop Rd
- 2290 Grandview Dr
- 0 Lanning Rd
- 123 Quail Dr
- 33 Bishop Rd
- 2024 Powdermill Hill Rd
- 2167 Powdermill Hill Rd
- 107 Pond Dr
- 105 Michael Cir
- 1120 Norton Rd
- 104 Michael Cir
- 100 Michael Cir
- 2 Michael Cir
- 106 Michael Cir
- 155 Michael Cir
- 108 Michael Cir
- 1131 Norton Rd
- 145 Michael Cir
- 174 Michael Cir
- 110 Michael Cir
- 139 Michael Cir
- 0 Michael Cir
- 167 Michael Cir
- 1260 Norton Rd
- 144 Michael Cir
- 137 1/2 Michael Cir
- 113 Michael Cir
- 137 Michael Cir