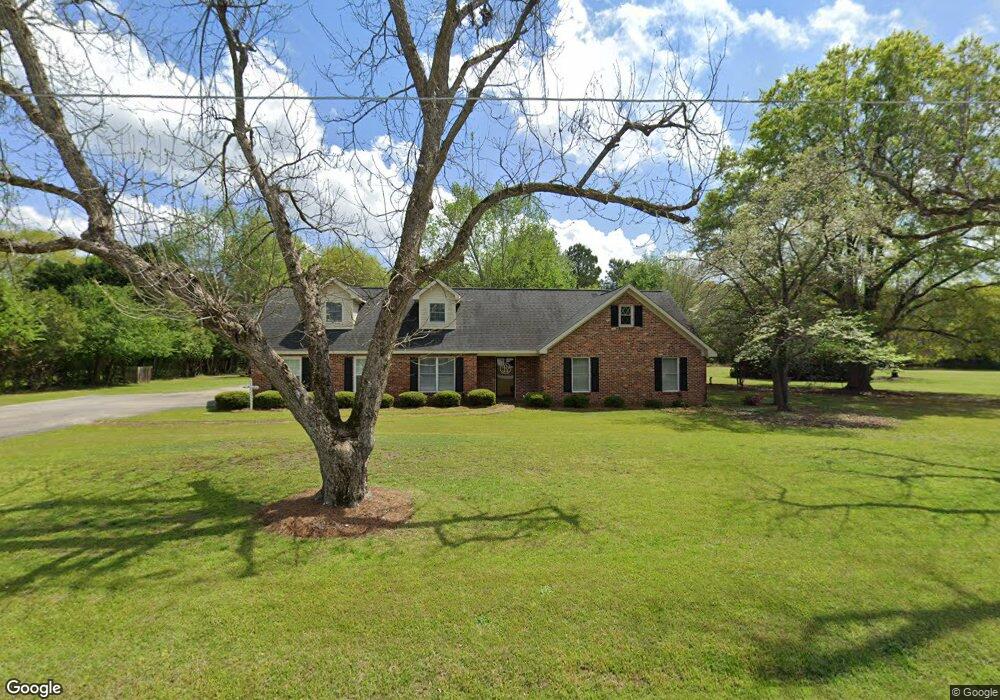
103 N Fairway Dr Kathleen, GA 31047
Estimated Value: $271,000 - $332,051
4
Beds
3
Baths
2,401
Sq Ft
$130/Sq Ft
Est. Value
About This Home
This home is located at 103 N Fairway Dr, Kathleen, GA 31047 and is currently estimated at $312,763, approximately $130 per square foot. 103 N Fairway Dr is a home located in Houston County with nearby schools including Langston Road Elementary School, Mossy Creek Middle School, and Perry High School.
Ownership History
Date
Name
Owned For
Owner Type
Purchase Details
Closed on
Oct 12, 1979
Sold by
Bennett Ronald C
Bought by
Bennett Jean G
Current Estimated Value
Purchase Details
Closed on
Jul 21, 1978
Sold by
Bennett Ronald C and Bennett Jean G
Bought by
Bennett Ronald C
Purchase Details
Closed on
Apr 3, 1978
Sold by
Bennett Construction Co
Bought by
Bennett Ronald C and Bennett Jean G
Purchase Details
Closed on
Jun 10, 1977
Sold by
Bennett Ronald C and Bennett Jean G
Bought by
Bennett Construction Co
Purchase Details
Closed on
May 2, 1976
Sold by
Gunter Gunter T and Gunter Sarah Y
Bought by
Bennett Ronald C and Bennett Jean G
Purchase Details
Closed on
Feb 28, 1974
Sold by
Layson James A
Bought by
Gunter Gunter T and Gunter Sarah Y
Purchase Details
Closed on
Mar 14, 1972
Sold by
Tunison Lucien
Bought by
Layson James A
Purchase Details
Closed on
Apr 28, 1970
Sold by
Exotic Lands Inc
Bought by
Tunison Lucien
Create a Home Valuation Report for This Property
The Home Valuation Report is an in-depth analysis detailing your home's value as well as a comparison with similar homes in the area
Home Values in the Area
Average Home Value in this Area
Purchase History
| Date | Buyer | Sale Price | Title Company |
|---|---|---|---|
| Bennett Jean G | -- | -- | |
| Bennett Ronald C | -- | -- | |
| Bennett Ronald C | $59,100 | -- | |
| Bennett Construction Co | $4,000 | -- | |
| Bennett Ronald C | -- | -- | |
| Gunter Gunter T | $3,500 | -- | |
| Layson James A | $2,000 | -- | |
| Tunison Lucien | $1,100 | -- |
Source: Public Records
Tax History Compared to Growth
Tax History
| Year | Tax Paid | Tax Assessment Tax Assessment Total Assessment is a certain percentage of the fair market value that is determined by local assessors to be the total taxable value of land and additions on the property. | Land | Improvement |
|---|---|---|---|---|
| 2024 | $2,008 | $85,960 | $24,000 | $61,960 |
| 2023 | $1,975 | $83,720 | $24,000 | $59,720 |
| 2022 | $1,956 | $82,920 | $24,000 | $58,920 |
| 2021 | $1,783 | $75,400 | $24,000 | $51,400 |
| 2020 | $1,724 | $72,640 | $24,000 | $48,640 |
| 2019 | $1,724 | $72,640 | $24,000 | $48,640 |
| 2018 | $1,479 | $62,600 | $13,960 | $48,640 |
| 2017 | $1,481 | $62,600 | $13,960 | $48,640 |
| 2016 | $1,376 | $58,240 | $13,960 | $44,280 |
| 2015 | $1,379 | $58,240 | $13,960 | $44,280 |
| 2014 | -- | $58,240 | $13,960 | $44,280 |
| 2013 | -- | $58,240 | $13,960 | $44,280 |
Source: Public Records
Map
Nearby Homes
- 125 Heather Glen Blvd
- 243 Mossland Dr
- 2403 Ga Hwy 127
- 119 Lakewood Dr
- 204 Weeping Moss Way
- 206 Black Birch Rd
- 206 Black Birch Rd Unit 62G
- 207 Black Birch Rd Unit 59G
- 205 Black Birch Rd Unit 58G
- 120 Bald Cypress Dr Unit 64G
- 203 Black Birch Rd Unit 57G
- 107 Gallberry Ln
- 107 Gallberry Ln Unit 50G
- 101 Pond Dr
- 105 N Fairway Dr
- 158 Sandefur Rd
- 156 Sandefur Rd
- 154 Sandefur Rd
- 102 N Fairway Dr
- 109 N Fairway Dr
- 104 N Fairway Dr
- 161 Sandefur Rd
- 157 Sandefur Rd Unit A-2
- 157 Sandefur Rd
- 111 N Fairway Dr
- 152 Sandefur Rd
- 106 N Fairway Dr
- 162 Sandefur Rd
- 148 Sandefur Rd
- 171 Sandefur Rd
- 143 Harner Rd
- 107 N Fairway Dr
- 145 Harner Rd
- 147 Harner Rd