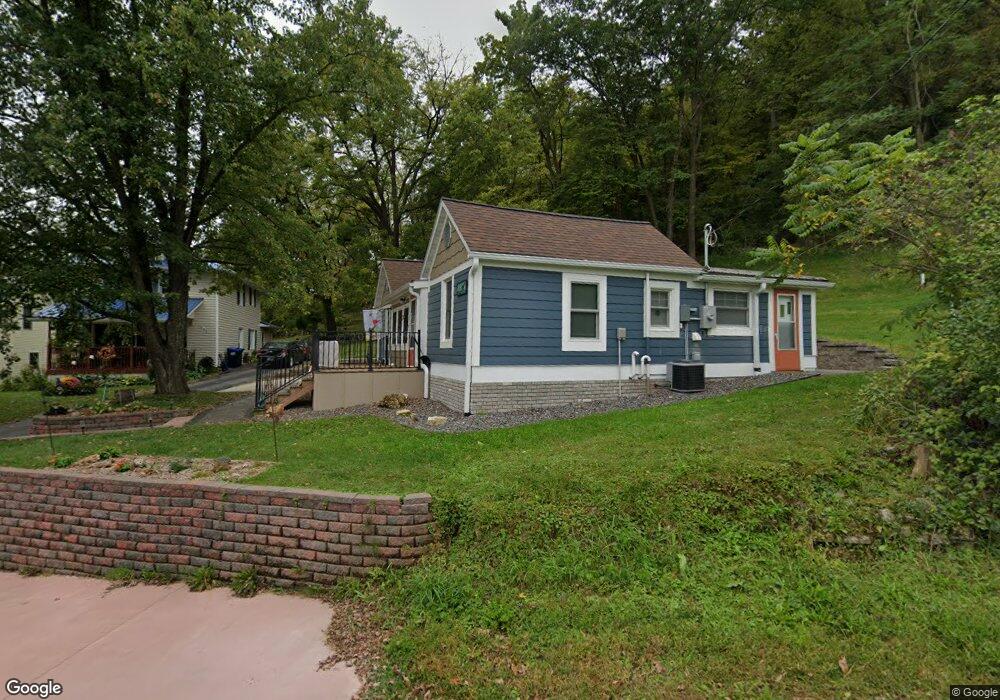
103 Norway Dr Lanesboro, MN 55949
Estimated Value: $207,649 - $237,000
3
Beds
1
Bath
940
Sq Ft
$242/Sq Ft
Est. Value
About This Home
This home is located at 103 Norway Dr, Lanesboro, MN 55949 and is currently estimated at $227,162, approximately $241 per square foot. 103 Norway Dr is a home located in Fillmore County with nearby schools including Lanesboro Elementary School and Lanesboro High School.
Ownership History
Date
Name
Owned For
Owner Type
Purchase Details
Closed on
Apr 16, 2025
Sold by
Geerdes Bryn S and Marks Tamara L
Bought by
Bryn S Geerdes Living Trust and Geerdes
Current Estimated Value
Purchase Details
Closed on
Oct 7, 2022
Sold by
Gingerich Ammon and Gingerich Cevilla
Bought by
Geerdes Bryn and Marks Tamara
Purchase Details
Closed on
Jul 27, 2020
Sold by
Pfeffer Joel W and Pfeffer Brooke E
Bought by
Gingerich Ammon D and Gingerich Cevilla
Home Financials for this Owner
Home Financials are based on the most recent Mortgage that was taken out on this home.
Original Mortgage
$136,000
Interest Rate
3%
Mortgage Type
New Conventional
Purchase Details
Closed on
Aug 15, 2017
Sold by
Sullivan Patrick J and Sullivan Harriet J
Bought by
Pfeffer Joel W and Pfeffer Brooke E
Purchase Details
Closed on
Oct 11, 2011
Sold by
Sullivan Pamela J
Bought by
Sullivan Patrick J
Create a Home Valuation Report for This Property
The Home Valuation Report is an in-depth analysis detailing your home's value as well as a comparison with similar homes in the area
Home Values in the Area
Average Home Value in this Area
Purchase History
| Date | Buyer | Sale Price | Title Company |
|---|---|---|---|
| Bryn S Geerdes Living Trust | $500 | None Listed On Document | |
| Geerdes Bryn | $189,000 | -- | |
| Gingerich Ammon D | $170,000 | None Available | |
| Pfeffer Joel W | $30,000 | None Available | |
| Sullivan Patrick J | -- | None Available |
Source: Public Records
Mortgage History
| Date | Status | Borrower | Loan Amount |
|---|---|---|---|
| Previous Owner | Gingerich Ammon D | $136,000 |
Source: Public Records
Tax History Compared to Growth
Tax History
| Year | Tax Paid | Tax Assessment Tax Assessment Total Assessment is a certain percentage of the fair market value that is determined by local assessors to be the total taxable value of land and additions on the property. | Land | Improvement |
|---|---|---|---|---|
| 2025 | $2,464 | $170,500 | $21,000 | $149,500 |
| 2024 | $2,464 | $142,500 | $21,000 | $121,500 |
| 2023 | $532 | $142,500 | $21,000 | $121,500 |
| 2022 | $532 | $50,700 | $21,000 | $29,700 |
| 2021 | $532 | $48,400 | $22,100 | $26,300 |
| 2020 | $720 | $48,400 | $22,100 | $26,300 |
| 2019 | $702 | $40,100 | $21,000 | $19,100 |
| 2018 | $378 | $40,100 | $21,000 | $19,100 |
| 2017 | -- | $51,700 | $21,000 | $30,700 |
| 2016 | $428 | $51,700 | $21,000 | $30,700 |
| 2015 | $447 | $26,900 | $12,581 | $14,319 |
| 2014 | $447 | $32,900 | $12,608 | $20,292 |
| 2013 | $447 | $32,800 | $12,615 | $20,185 |
Source: Public Records
Map
Nearby Homes
- 105 Parkway Ave N
- 201 Ridgeview Ln S Unit 204
- 206 Elmwood St E
- 208 Elmwood St E
- 301 Kirkwood St E
- 709 Rochelle Ave S
- 407 Johnson Dr
- 402 Hillcrest St E
- 708 Parkway Ave S
- 300 Whittier St W
- TBD State 16
- 34760 Fawn Dr
- 34869 Fawn Dr
- Tbd State Highway 16
- TBD 331st Ave
- 20376 County Highway 19
- 20376 County 19
- TBD County Road 19
- 213 North St NE
- 605 Lincoln St SE
- 101 Norway Dr
- 105 Norway Dr
- 107 Norway Dr
- 109 Norway Dr
- 100 Norway Dr
- 114 114 Norway Dr
- 114 Norway Dr
- xxxx Minnesota 250
- 401 Parkway Ave S
- 503 Parkway Ave S
- TBD Grit Rd
- 109 Parkway Ave N
- 109 Parkway Ave S
- 100 Kirkwood St E
- 0 County Highway 21
- 500 Parkway Ave S
- 101 Parkway Ave S
- 104 Parkway Ave S
- 509 Parkway Ave S
- 106 Parkway Ave S