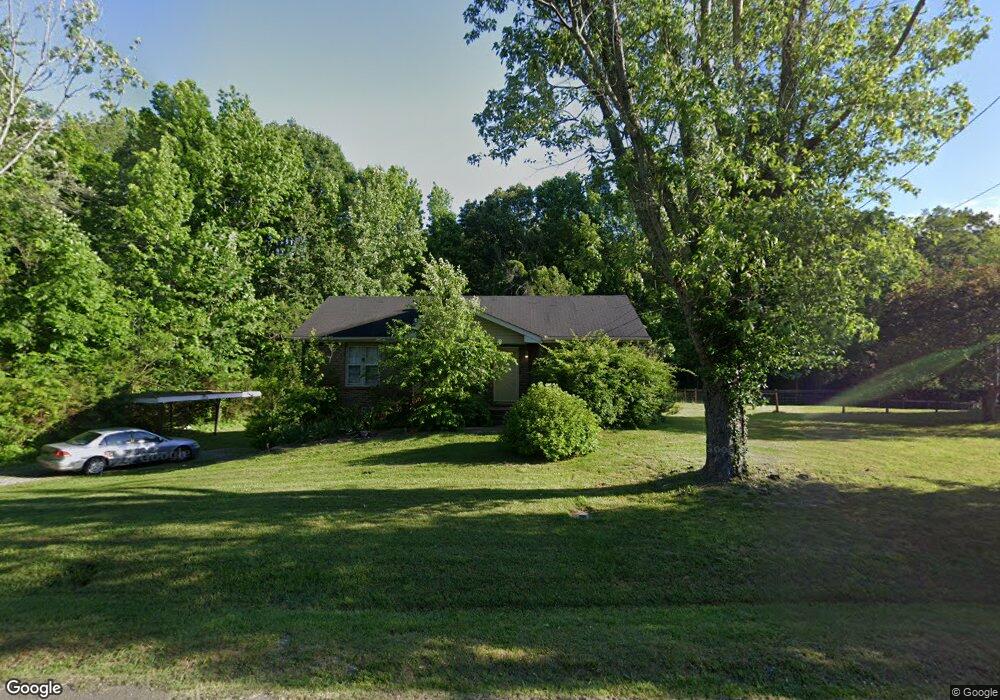
103 Nottingham Rd Dickson, TN 37055
Estimated Value: $238,486 - $276,000
Studio
1
Bath
1,056
Sq Ft
$239/Sq Ft
Est. Value
About This Home
This home is located at 103 Nottingham Rd, Dickson, TN 37055 and is currently estimated at $252,122, approximately $238 per square foot. 103 Nottingham Rd is a home located in Dickson County with nearby schools including Oakmont Elementary School, Burns Middle School, and Dickson County High School.
Ownership History
Date
Name
Owned For
Owner Type
Purchase Details
Closed on
Apr 4, 2008
Sold by
Camper Randy
Bought by
Boyle Teesha W
Current Estimated Value
Home Financials for this Owner
Home Financials are based on the most recent Mortgage that was taken out on this home.
Original Mortgage
$103,000
Interest Rate
6.03%
Purchase Details
Closed on
Sep 8, 2003
Sold by
Bank Of New York
Bought by
Camper Randy
Home Financials for this Owner
Home Financials are based on the most recent Mortgage that was taken out on this home.
Original Mortgage
$64,600
Interest Rate
6.13%
Purchase Details
Closed on
Jun 2, 2003
Sold by
Frierson Jimmy L
Bought by
Bank Of New York
Purchase Details
Closed on
Mar 30, 2000
Sold by
Hampton Joyce F
Bought by
Frierson Ruth Ann
Purchase Details
Closed on
Mar 1, 1988
Bought by
Hampton Joyce F
Purchase Details
Closed on
Nov 20, 1987
Bought by
United State Of America
Purchase Details
Closed on
Oct 30, 1981
Bought by
Patrick David H and Patrick Phyllis D
Create a Home Valuation Report for This Property
The Home Valuation Report is an in-depth analysis detailing your home's value as well as a comparison with similar homes in the area
Home Values in the Area
Average Home Value in this Area
Purchase History
| Date | Buyer | Sale Price | Title Company |
|---|---|---|---|
| Boyle Teesha W | $104,900 | -- | |
| Camper Randy | $68,000 | -- | |
| Bank Of New York | $6,920 | -- | |
| Frierson Ruth Ann | $77,900 | -- | |
| Hampton Joyce F | $45,000 | -- | |
| United State Of America | -- | -- | |
| Patrick David H | -- | -- |
Source: Public Records
Mortgage History
| Date | Status | Borrower | Loan Amount |
|---|---|---|---|
| Closed | Patrick David H | $103,000 | |
| Previous Owner | Patrick David H | $64,600 |
Source: Public Records
Tax History
| Year | Tax Paid | Tax Assessment Tax Assessment Total Assessment is a certain percentage of the fair market value that is determined by local assessors to be the total taxable value of land and additions on the property. | Land | Improvement |
|---|---|---|---|---|
| 2025 | -- | $48,300 | $12,750 | $35,550 |
| 2024 | -- | $48,300 | $12,750 | $35,550 |
| 2023 | $1,178 | $37,700 | $6,250 | $31,450 |
| 2022 | $1,178 | $37,700 | $6,250 | $31,450 |
| 2021 | $1,178 | $37,700 | $6,250 | $31,450 |
| 2020 | $1,178 | $37,700 | $6,250 | $31,450 |
| 2019 | $1,178 | $37,700 | $6,250 | $31,450 |
| 2018 | $991 | $27,150 | $5,000 | $22,150 |
| 2017 | $991 | $27,150 | $5,000 | $22,150 |
| 2016 | $991 | $27,150 | $5,000 | $22,150 |
| 2015 | $912 | $23,500 | $5,000 | $18,500 |
| 2014 | $912 | $23,500 | $5,000 | $18,500 |
Source: Public Records
Map
Nearby Homes
- 126 Robin Hood Rd
- 120 Robin Hood Rd
- 0 Pomona Rd
- 118 Spanish Ct
- 116 Friar Tuck Dr
- 123 Hogin Rd
- 115 Spanish Ct
- 101 Southwood Dr
- 0 Hogan Rd
- 105 Mae Cir
- 121 Marilyn Dr
- 322 Kaiser Rd
- 326 Kaiser Rd
- 714 Monarchos Bend
- 640 Whirlaway Dr
- 408 Barbaro Ct
- 614 Whirlaway Dr
- 611 Whirlaway Dr
- 303 Wyburn Place
- 212 Wyburn Place
- 105 Nottingham Rd
- 1540 Old Columbia Rd
- 107 Nottingham Rd
- 104 Nottingham Rd
- 100 Nottingham Rd
- 106 Nottingham Rd
- 1108 Old Columbia Rd
- 1201 Old Columbia Rd
- 1115 Old Columbia Rd
- 111 Nottingham Rd
- 501 Meadow Haven Ln
- 1211 Old Columbia Rd
- 1213 Old Columbia Rd
- 503 Meadow Haven Ln
- 1215 Old Columbia Rd
- 110 Nottingham Rd
- 113 Nottingham Rd
- 1107 Old Columbia Rd
- 505 Meadow Haven Ln
- 507 Meadow Haven Ln
Your Personal Tour Guide
Ask me questions while you tour the home.