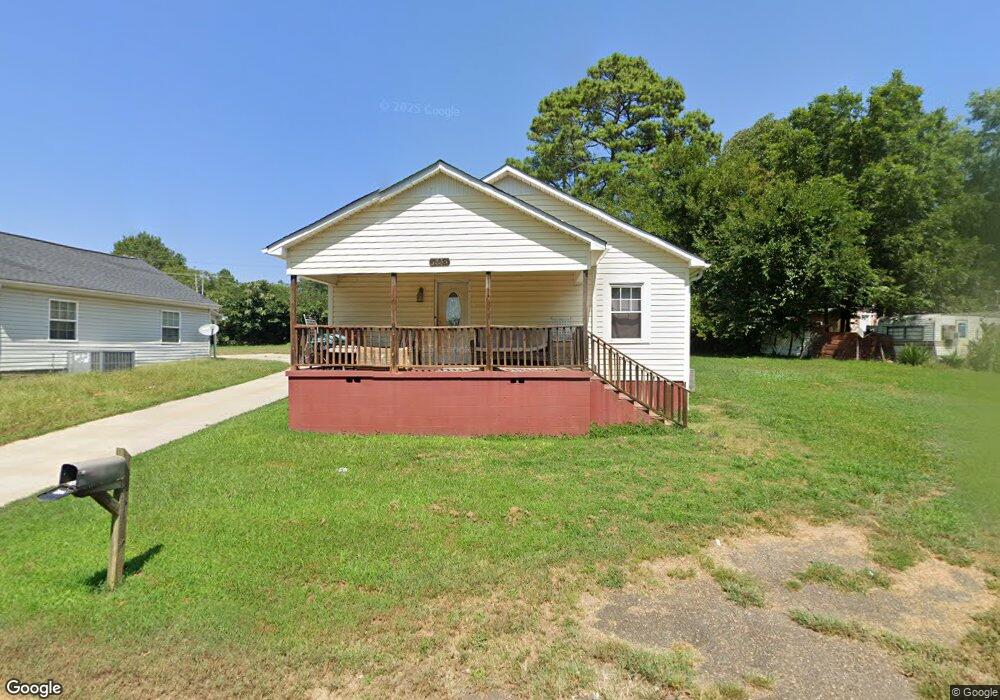
103 Quinn St Anderson, SC 29625
Estimated Value: $46,000 - $96,000
2
Beds
1
Bath
852
Sq Ft
$89/Sq Ft
Est. Value
About This Home
This home is located at 103 Quinn St, Anderson, SC 29625 and is currently estimated at $75,981, approximately $89 per square foot. 103 Quinn St is a home located in Anderson County with nearby schools including Centerville Elementary School, Westside High School, and Anderson Institute of Technology.
Ownership History
Date
Name
Owned For
Owner Type
Purchase Details
Closed on
Aug 28, 2015
Sold by
Melton Jeff and Gaylord Toni
Bought by
Home Sweet Home Llc
Current Estimated Value
Purchase Details
Closed on
Aug 24, 2007
Sold by
Ginn Johnnie T and Ginn Dale D
Bought by
Melton Jeffrey and Gaylord Toni
Purchase Details
Closed on
Jan 13, 2005
Sold by
Abn Amro Mortgage Group Inc
Bought by
Ginn Johnnie T and Ginn Dale D
Purchase Details
Closed on
Mar 16, 2004
Sold by
Federal Home Loan Mortgage Corporation
Bought by
Abn Amro Mortgage Group Inc
Purchase Details
Closed on
Nov 17, 2003
Sold by
Master In Equity
Bought by
Federal Home Loan Mortgage Corporation
Create a Home Valuation Report for This Property
The Home Valuation Report is an in-depth analysis detailing your home's value as well as a comparison with similar homes in the area
Home Values in the Area
Average Home Value in this Area
Purchase History
| Date | Buyer | Sale Price | Title Company |
|---|---|---|---|
| Home Sweet Home Llc | $12,000 | -- | |
| Melton Jeffrey | $15,000 | None Available | |
| Ginn Johnnie T | $9,700 | -- | |
| Abn Amro Mortgage Group Inc | -- | -- | |
| Federal Home Loan Mortgage Corporation | $42,871 | -- |
Source: Public Records
Tax History Compared to Growth
Tax History
| Year | Tax Paid | Tax Assessment Tax Assessment Total Assessment is a certain percentage of the fair market value that is determined by local assessors to be the total taxable value of land and additions on the property. | Land | Improvement |
|---|---|---|---|---|
| 2024 | $349 | $760 | $220 | $540 |
| 2023 | $349 | $760 | $220 | $540 |
| 2022 | $312 | $760 | $220 | $540 |
| 2021 | $296 | $680 | $210 | $470 |
| 2020 | $290 | $680 | $210 | $470 |
| 2019 | $290 | $680 | $210 | $470 |
| 2018 | $287 | $680 | $210 | $470 |
| 2017 | -- | $680 | $210 | $470 |
| 2016 | $295 | $720 | $270 | $450 |
| 2015 | $295 | $940 | $270 | $670 |
| 2014 | $354 | $940 | $270 | $670 |
Source: Public Records
Map
Nearby Homes