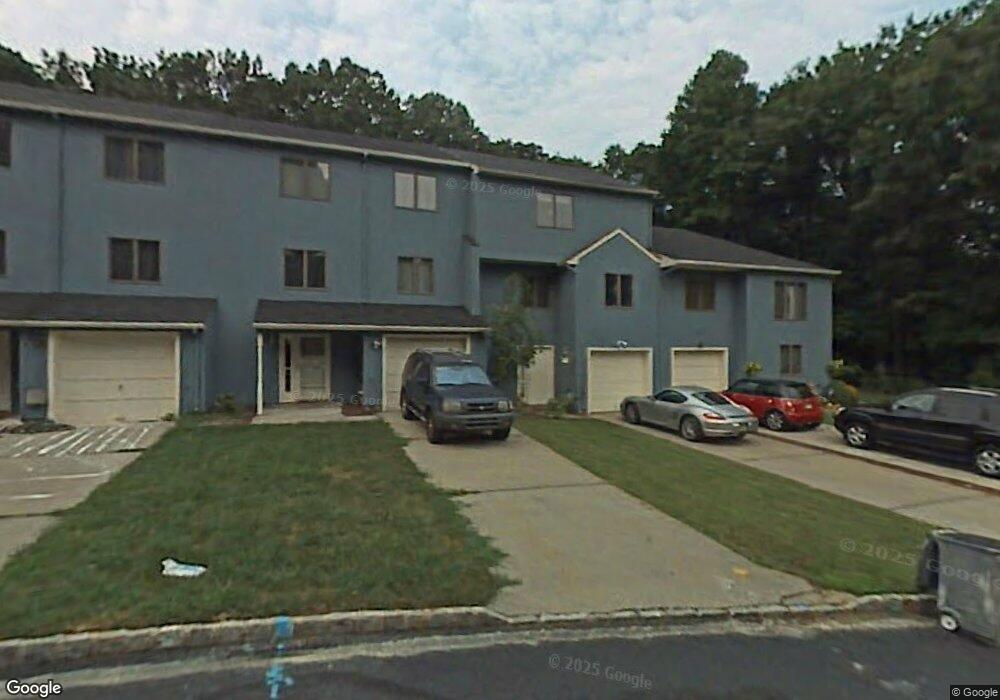
103 Redpine Loop Old Bridge, NJ 08857
Estimated Value: $495,000 - $569,638
3
Beds
3
Baths
1,744
Sq Ft
$312/Sq Ft
Est. Value
About This Home
This home is located at 103 Redpine Loop, Old Bridge, NJ 08857 and is currently estimated at $544,910, approximately $312 per square foot. 103 Redpine Loop is a home located in Middlesex County with nearby schools including Old Bridge High School, St. Thomas the Apostle School, and St. Ambrose School.
Ownership History
Date
Name
Owned For
Owner Type
Purchase Details
Closed on
Jan 30, 2013
Sold by
Loiacono Karen
Bought by
Atique Abul
Current Estimated Value
Home Financials for this Owner
Home Financials are based on the most recent Mortgage that was taken out on this home.
Original Mortgage
$176,250
Outstanding Balance
$123,379
Interest Rate
3.44%
Mortgage Type
New Conventional
Estimated Equity
$421,531
Purchase Details
Closed on
Mar 26, 2004
Sold by
Vassallo Joseph
Bought by
Pallotti Eric
Home Financials for this Owner
Home Financials are based on the most recent Mortgage that was taken out on this home.
Original Mortgage
$270,750
Interest Rate
5.36%
Purchase Details
Closed on
Jul 16, 2003
Sold by
Tcif Reo2 Llc
Bought by
Vassallo Joseph
Home Financials for this Owner
Home Financials are based on the most recent Mortgage that was taken out on this home.
Original Mortgage
$156,000
Interest Rate
6.31%
Create a Home Valuation Report for This Property
The Home Valuation Report is an in-depth analysis detailing your home's value as well as a comparison with similar homes in the area
Home Values in the Area
Average Home Value in this Area
Purchase History
| Date | Buyer | Sale Price | Title Company |
|---|---|---|---|
| Atique Abul | $235,000 | None Available | |
| Pallotti Eric | $285,000 | -- | |
| Vassallo Joseph | $196,000 | -- |
Source: Public Records
Mortgage History
| Date | Status | Borrower | Loan Amount |
|---|---|---|---|
| Open | Atique Abul | $176,250 | |
| Previous Owner | Pallotti Eric | $270,750 | |
| Previous Owner | Vassallo Joseph | $156,000 |
Source: Public Records
Tax History
| Year | Tax Paid | Tax Assessment Tax Assessment Total Assessment is a certain percentage of the fair market value that is determined by local assessors to be the total taxable value of land and additions on the property. | Land | Improvement |
|---|---|---|---|---|
| 2025 | $7,561 | $133,900 | $34,000 | $99,900 |
| 2024 | $7,253 | $133,900 | $34,000 | $99,900 |
| 2023 | $7,253 | $133,900 | $34,000 | $99,900 |
| 2022 | $7,087 | $133,900 | $34,000 | $99,900 |
| 2021 | $4,866 | $133,900 | $34,000 | $99,900 |
| 2020 | $6,878 | $133,900 | $34,000 | $99,900 |
| 2019 | $6,762 | $133,900 | $34,000 | $99,900 |
| 2018 | $6,687 | $133,900 | $34,000 | $99,900 |
| 2017 | $6,470 | $133,900 | $34,000 | $99,900 |
| 2016 | $6,336 | $133,900 | $34,000 | $99,900 |
| 2015 | $6,226 | $133,900 | $34,000 | $99,900 |
| 2014 | $6,163 | $133,900 | $34,000 | $99,900 |
Source: Public Records
Map
Nearby Homes
- 1732 New Jersey 18
- 815 Marlboro Rd
- 0-0 By Palmer Bridge
- 1800 New Jersey 18
- 25 Morsell Place
- 11 Lincroft Ave
- 42 Mariposa Place
- 50 Creighton Cir
- 26 Exeter St
- 27 Mabaline Rd
- 120 Diamond Ln
- 109 Throckmorton Ln
- 17 Willow Dr
- 52 Gaub Rd
- 1122 Marlboro Rd
- 51 Malibu Ct
- 18 Grace Dr
- 62 Stevens Ave
- 5 Harold St
- 21 Warren Dr
- 105 Redpine Loop
- 101 Redpine Loop
- 107 Redpine Loop
- 109 Redpine Loop
- 111 Redpine Loop
- 115 Redpine Loop
- 117 Redpine Loop
- 119 Redpine Loop
- 121 Redpine Loop
- 123 Redpine Loop
- 11 Carmel Ct
- 9 Carmel Ct
- 125 Redpine Loop
- 7 Carmel Ct
- 5 Carmel Ct
- 15 Carmel Ct
- 3 Carmel Ct
- 132 Redpine Loop
- 17 Carmel Ct
- 1 Carmel Ct
Your Personal Tour Guide
Ask me questions while you tour the home.