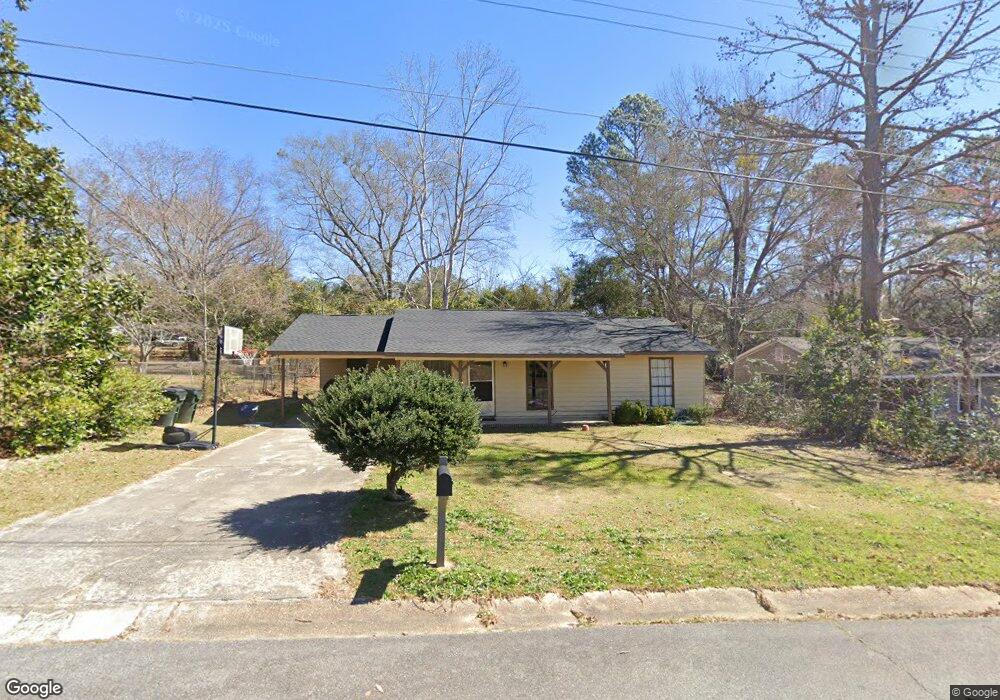
103 Redwood Dr Warner Robins, GA 31088
Estimated Value: $133,000 - $166,000
--
Bed
2
Baths
1,151
Sq Ft
$124/Sq Ft
Est. Value
About This Home
This home is located at 103 Redwood Dr, Warner Robins, GA 31088 and is currently estimated at $142,780, approximately $124 per square foot. 103 Redwood Dr is a home located in Houston County with nearby schools including Miller Elementary School, Warner Robins Middle School, and Warner Robins High School.
Ownership History
Date
Name
Owned For
Owner Type
Purchase Details
Closed on
Oct 21, 2008
Sold by
Southfork Investment Company Llc
Bought by
Morris Richard A
Current Estimated Value
Home Financials for this Owner
Home Financials are based on the most recent Mortgage that was taken out on this home.
Original Mortgage
$41,936
Outstanding Balance
$6,963
Interest Rate
5.96%
Mortgage Type
Seller Take Back
Estimated Equity
$135,817
Purchase Details
Closed on
Dec 5, 2000
Sold by
Mashburn Jessica Nichols
Bought by
Southfork Investment Company Llc
Purchase Details
Closed on
Sep 30, 1997
Sold by
Davis Joel Timothy
Bought by
Mashburn Jessica Nichols
Purchase Details
Closed on
Jul 28, 1995
Sold by
Coleman Helen Frances
Bought by
Davis Joel Timothy
Purchase Details
Closed on
Sep 22, 1993
Sold by
Woelfel Helen Frances
Bought by
Coleman Helen Frances
Purchase Details
Closed on
Jul 27, 1984
Bought by
Woelfel Helen Frances
Create a Home Valuation Report for This Property
The Home Valuation Report is an in-depth analysis detailing your home's value as well as a comparison with similar homes in the area
Home Values in the Area
Average Home Value in this Area
Purchase History
| Date | Buyer | Sale Price | Title Company |
|---|---|---|---|
| Morris Richard A | $42,000 | None Available | |
| Southfork Investment Company Llc | $47,900 | -- | |
| Mashburn Jessica Nichols | $49,900 | -- | |
| Davis Joel Timothy | $50,000 | -- | |
| Coleman Helen Frances | -- | -- | |
| Woelfel Helen Frances | -- | -- |
Source: Public Records
Mortgage History
| Date | Status | Borrower | Loan Amount |
|---|---|---|---|
| Open | Morris Richard A | $41,936 |
Source: Public Records
Tax History Compared to Growth
Tax History
| Year | Tax Paid | Tax Assessment Tax Assessment Total Assessment is a certain percentage of the fair market value that is determined by local assessors to be the total taxable value of land and additions on the property. | Land | Improvement |
|---|---|---|---|---|
| 2024 | $1,255 | $38,360 | $4,000 | $34,360 |
| 2023 | $1,047 | $31,760 | $4,000 | $27,760 |
| 2022 | $536 | $23,320 | $3,200 | $20,120 |
| 2021 | $514 | $22,240 | $3,200 | $19,040 |
| 2020 | $515 | $22,160 | $3,200 | $18,960 |
| 2019 | $515 | $22,160 | $3,200 | $18,960 |
| 2018 | $515 | $22,160 | $3,200 | $18,960 |
| 2017 | $515 | $22,160 | $3,200 | $18,960 |
| 2016 | $516 | $22,160 | $3,200 | $18,960 |
| 2015 | -- | $22,160 | $3,200 | $18,960 |
| 2014 | -- | $22,160 | $3,200 | $18,960 |
| 2013 | -- | $22,160 | $3,200 | $18,960 |
Source: Public Records
Map
Nearby Homes
- 105 Redwood Dr
- 101 Redwood Dr
- 107 Redwood Dr
- 122 Kirkwood Cir
- 102 Redwood Dr
- 100 Redwood Dr
- 104 Redwood Dr
- 124 Kirkwood Cir
- 109 Redwood Dr
- 106 Redwood Dr
- 126 Kirkwood Cir
- 108 Redwood Dr
- 109 Kirkwood Cir
- 111 Kirkwood Cir
- 111 Redwood Dr
- 121 Kirkwood Cir
- 123 Kirkwood Cir
- 107 Kirkwood Cir
- 105 Kim Way
- 128 Kirkwood Cir