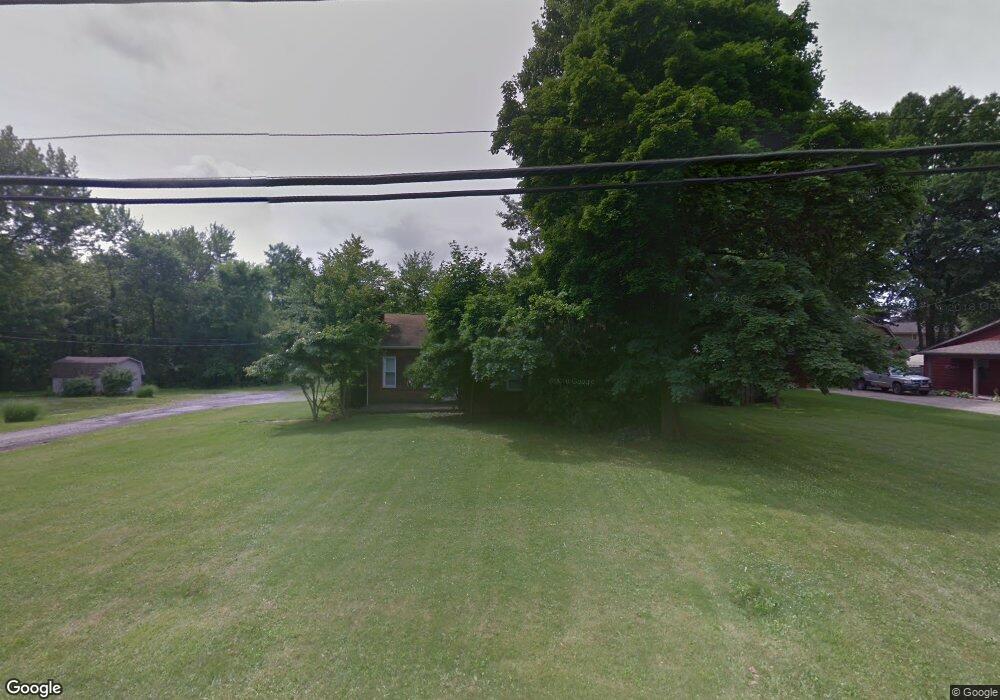
103 Roche Way Youngstown, OH 44512
Estimated Value: $126,600 - $156,000
2
Beds
1
Bath
934
Sq Ft
$156/Sq Ft
Est. Value
About This Home
This home is located at 103 Roche Way, Youngstown, OH 44512 and is currently estimated at $145,900, approximately $156 per square foot. 103 Roche Way is a home located in Mahoning County with nearby schools including Boardman Center Middle School, Stadium Drive Elementary School, and Boardman High School.
Ownership History
Date
Name
Owned For
Owner Type
Purchase Details
Closed on
Aug 4, 2022
Sold by
Fox Lawrence
Bought by
Fox Shalyne
Current Estimated Value
Purchase Details
Closed on
Dec 20, 2004
Sold by
Tyler Suzanne Acy and Tyler Craig
Bought by
Fox Lawrence and Fox Shalyne
Home Financials for this Owner
Home Financials are based on the most recent Mortgage that was taken out on this home.
Original Mortgage
$59,500
Interest Rate
5.84%
Mortgage Type
Purchase Money Mortgage
Purchase Details
Closed on
Nov 26, 1999
Sold by
Tyler Suzanne Aey
Bought by
Fox Lawrence Thomas and Fox Shalyne Rae
Home Financials for this Owner
Home Financials are based on the most recent Mortgage that was taken out on this home.
Original Mortgage
$64,684
Interest Rate
7.9%
Mortgage Type
Seller Take Back
Purchase Details
Closed on
May 28, 1998
Sold by
Aey Edward B and Aey Denise L
Bought by
Aey Suzanne
Purchase Details
Closed on
Jan 12, 1981
Bought by
Aey Edward B and Aey Denise L
Create a Home Valuation Report for This Property
The Home Valuation Report is an in-depth analysis detailing your home's value as well as a comparison with similar homes in the area
Home Values in the Area
Average Home Value in this Area
Purchase History
| Date | Buyer | Sale Price | Title Company |
|---|---|---|---|
| Fox Shalyne | -- | None Listed On Document | |
| Fox Shalyne | -- | None Listed On Document | |
| Fox Lawrence | $74,700 | -- | |
| Fox Lawrence Thomas | $74,684 | -- | |
| Aey Suzanne | $38,976 | -- | |
| Aey Edward B | -- | -- |
Source: Public Records
Mortgage History
| Date | Status | Borrower | Loan Amount |
|---|---|---|---|
| Previous Owner | Fox Lawrence | $59,500 | |
| Previous Owner | Fox Lawrence Thomas | $64,684 |
Source: Public Records
Tax History Compared to Growth
Tax History
| Year | Tax Paid | Tax Assessment Tax Assessment Total Assessment is a certain percentage of the fair market value that is determined by local assessors to be the total taxable value of land and additions on the property. | Land | Improvement |
|---|---|---|---|---|
| 2024 | $1,836 | $35,940 | $5,560 | $30,380 |
| 2023 | $1,812 | $35,940 | $5,560 | $30,380 |
| 2022 | $1,429 | $21,560 | $5,560 | $16,000 |
| 2021 | $1,430 | $21,560 | $5,560 | $16,000 |
| 2020 | $1,437 | $21,560 | $5,560 | $16,000 |
| 2019 | $1,534 | $20,350 | $5,250 | $15,100 |
| 2018 | $1,293 | $20,350 | $5,250 | $15,100 |
| 2017 | $1,287 | $20,350 | $5,250 | $15,100 |
| 2016 | $1,285 | $20,080 | $5,250 | $14,830 |
| 2015 | $1,259 | $20,080 | $5,250 | $14,830 |
| 2014 | $1,263 | $20,080 | $5,250 | $14,830 |
| 2013 | $1,247 | $20,080 | $5,250 | $14,830 |
Source: Public Records
Map
Nearby Homes
- 8218 Maramont Dr Unit B
- 123 Mayflower Dr
- 134 Mayflower Dr
- 8479 Crystal Dr
- 102 Carter Cir Unit 1
- 454 Garver Dr
- 0 W Western Reserve Rd Unit 5146459
- 8516 Hitchcock Rd
- 1242 W Western Reserve Rd
- 9144 Sharrott Rd
- 517 Berklee Dr
- 9264 Sharrott Rd Unit 1803
- 9264 Sharrott Rd Unit 1001
- 9264 Sharrott Rd Unit 104
- 9264 Sharrott Rd Unit 1002
- 221 Stafford Ave
- Lot 36 Berklee Dr
- 331 Warren Ave
- 110 Boardman Blvd
- 107 Berklee Dr
- 121 Roche Way
- 97 Roche Way
- 127 Roche Way
- 104 Roche Way
- 96 Roche Way
- 8347 Stoney Creek Dr
- 92 Roche Way
- 75 Roche Way
- 133 Roche Way
- 8353 Stoney Creek Dr
- 69 Roche Way
- 128 Roche Way
- 8210 Maramont Dr
- 8208 Maramont Dr Unit 8208
- 8212 Maramont Dr Unit B
- 8212 Maramont Dr Unit A
- 8400 Crystal Dr
- 65 Roche Way
- 78 Roche Way
- 139 Roche Way