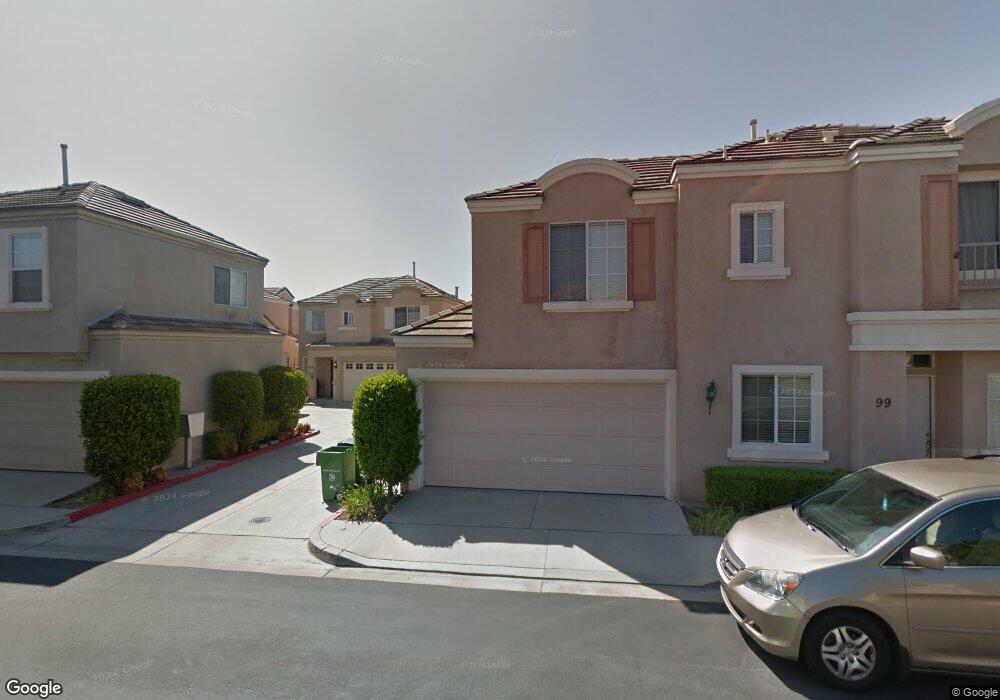
103 Rue Monet Unit 130 Foothill Ranch, CA 92610
Estimated Value: $726,044 - $834,000
2
Beds
2
Baths
1,086
Sq Ft
$716/Sq Ft
Est. Value
About This Home
This home is located at 103 Rue Monet Unit 130, Foothill Ranch, CA 92610 and is currently estimated at $777,761, approximately $716 per square foot. 103 Rue Monet Unit 130 is a home located in Orange County with nearby schools including Foothill Ranch Elementary School, Rancho Santa Margarita Intermediate School, and Trabuco Hills High School.
Ownership History
Date
Name
Owned For
Owner Type
Purchase Details
Closed on
Oct 9, 2002
Sold by
Phaneuf Armand and Phaneuf Paula R
Bought by
Phaneuf Robert
Current Estimated Value
Home Financials for this Owner
Home Financials are based on the most recent Mortgage that was taken out on this home.
Original Mortgage
$152,600
Interest Rate
6.05%
Mortgage Type
Balloon
Purchase Details
Closed on
Oct 15, 1999
Sold by
Boivin Kirk and Boivin Michelle
Bought by
Phaneuf Robert and Phaneuf Armand
Home Financials for this Owner
Home Financials are based on the most recent Mortgage that was taken out on this home.
Original Mortgage
$154,800
Interest Rate
7.75%
Purchase Details
Closed on
May 29, 1997
Sold by
John Laing Homes Inc
Bought by
Boivin Kirk and Mckerlie Michelle
Home Financials for this Owner
Home Financials are based on the most recent Mortgage that was taken out on this home.
Original Mortgage
$140,101
Interest Rate
7.91%
Mortgage Type
FHA
Create a Home Valuation Report for This Property
The Home Valuation Report is an in-depth analysis detailing your home's value as well as a comparison with similar homes in the area
Home Values in the Area
Average Home Value in this Area
Purchase History
| Date | Buyer | Sale Price | Title Company |
|---|---|---|---|
| Phaneuf Robert | -- | Orange Coast Title Company | |
| Phaneuf Robert | $193,500 | -- | |
| Boivin Kirk | $147,000 | Chicago Title Co |
Source: Public Records
Mortgage History
| Date | Status | Borrower | Loan Amount |
|---|---|---|---|
| Closed | Phaneuf Robert | $152,600 | |
| Closed | Phaneuf Robert | $154,800 | |
| Previous Owner | Boivin Kirk | $140,101 |
Source: Public Records
Tax History Compared to Growth
Tax History
| Year | Tax Paid | Tax Assessment Tax Assessment Total Assessment is a certain percentage of the fair market value that is determined by local assessors to be the total taxable value of land and additions on the property. | Land | Improvement |
|---|---|---|---|---|
| 2025 | $2,976 | $297,391 | $125,642 | $171,749 |
| 2024 | $2,976 | $291,560 | $123,178 | $168,382 |
| 2023 | $2,905 | $285,844 | $120,763 | $165,081 |
| 2022 | $2,852 | $280,240 | $118,395 | $161,845 |
| 2021 | $2,524 | $274,746 | $116,074 | $158,672 |
| 2020 | $2,768 | $271,929 | $114,883 | $157,046 |
| 2019 | $2,712 | $266,598 | $112,631 | $153,967 |
| 2018 | $2,660 | $261,371 | $110,422 | $150,949 |
| 2017 | $2,605 | $256,247 | $108,257 | $147,990 |
| 2016 | $2,868 | $251,223 | $106,134 | $145,089 |
| 2015 | $2,855 | $247,450 | $104,540 | $142,910 |
| 2014 | $3,079 | $242,603 | $102,492 | $140,111 |
Source: Public Records
Map
Nearby Homes
- 101 Rue Monet
- 105 Rue Monet Unit 131
- 99 Rue Monet
- 97 Rue Monet
- 107 Rue Monet Unit 132
- 109 Rue Monet Unit 133
- 113 Rue Monet Unit 135
- 91 Rue Monet Unit 124
- 95 Rue Monet Unit 126
- 93 Rue Monet
- 108 Rue Monet
- 89 Rue Monet Unit 123
- 111 Rue Monet Unit 134
- 100 Rue Monet
- 117 Rue Monet Unit 137
- 115 Rue Monet Unit 136
- 110 Rue Monet
- 104 Rue Monet
- 112 Rue Monet
- 102 Rue Monet Unit 149